

Investors often choose diversified, multi-factor strategies to overcome the limitations of traditional cap-weighted benchmarks. These benchmarks are overly concentrated on companies with the largest market capitalization and expose investors to idiosyncratic risks that are not rewarded over the long term. Moreover, cap-weighted benchmarks incorporate no explicit objective to capture exposure to those risk factors that have been documented in the academic literature to offer a long-term reward.
Significant deviations from the traditional cap-weighted benchmark are required, therefore, to deliver stronger risk-adjusted performance over the long term. Namely, choosing stocks that target explicit exposures to rewarded factors and applying a well-diversified weighting scheme to manage stock specific risks.
However, deviations from the benchmark create unintentional exposure to economic risks. For example, if a factor portfolio is too heavily tilted toward low volatility stocks, it may behave in an overly “bond-like” manner and accordingly exhibit strong sensitivity to Treasury yields and movements in the yield curve. Ideally, your factor portfolio will deliver factor premia in a systematic and reliable fashion without such undue sensitivity to economic risks that create additional tracking error for no additional long-term reward.
In this article, I outline a methodology — which we call EconRisk — to mitigate economic risks of factor-driven equity strategies and eliminate unnecessary tracking error by keeping strong exposures to rewarded factors and preserving diversification benefits.
Getting Exposures to Rewarded Factors
There are six consensus rewarded factors that emerge from academic literature and that have passed sufficient hurdles to be considered robust, namely size, value, momentum, volatility, profitability, and investment. Their long-term reward is justified by economic rationale.
Investors require compensation for additional risks brought by factor exposures in bad times when assets that correspond to a given factor tilt tend to provide poor payoffs (Cochrane, 2005). For instance, to build the value factor sleeve of our multi-factor index, we first select stocks with the highest book-to-market ratio adjusted for unrecorded intangibles to acquire the desired exposure. When doing so, we might select value stocks with negative exposures to other rewarded factors such as profitability, for example (Fama and French, 1995), Zhang (2005). This could be problematic when assembling the different factor sleeves into a multi-factor portfolio, since it will lead to factor dilution.
To account for this effect, we screen out from the value selection the stocks with poor characteristics to other rewarded factors. This approach enables us to design single-factor sleeves with strong exposure to their desired factor but without negative exposures to other rewarded factors. The goal is to build multi-factor portfolios with strong and well-balanced exposure to all rewarded factors.
Reducing Idiosyncratic Risks
The second objective is the diversification of idiosyncratic risks. Indeed, we want to avoid the performance of our multi-factor indices, which should be driven by exposure to the market and rewarded factors, being significantly impacted by stock-specific shocks, since they can be mitigated by holding diversified portfolios. Typically, an investor would not want the performance of their multi-factor portfolio to be negatively affected by a profit warning made by a single company. The reasons is this unexpected shock is not related to the premium of the market of rewarded factors and is only company specific. Hence, we combine four different weighting schemes that are proxies of the mean-variance optimal portfolio (Markowitz, 1952). Each weighting scheme implies some trade-offs between estimation and optimality risks. For example, one of the four weighting schemes that we use is the Max Deconcentration. This has no estimation risks because it assumes that volatility, correlations, and expected returns are all identical across stocks. Given this strong assumption, this weighting scheme will be far from the mean-variance optimality. To mitigate the estimation and optimality risks of each weighting scheme, we simply average them together into a diversified multi-strategy weighting scheme.
Unintentional Economic Risks
Both sources of deviations discussed above are necessary to achieve the objective of long-term risk-adjusted performance improvement compared to the cap-weighted benchmark. Nonetheless, they create implicit exposures to economic risks that can affect the short-term performance of factor strategies. A low-volatility factor portfolio, for example, tends to overweight utilities companies, which are more sensitive to interest rate risks than the stocks in the cap-weighted benchmark. This is illustrated in Table 1. The sensitivity of each single-factor sleeve of our Developed Multi-Factor Index to each of the economic risk factors that we have in our menu. Each factor sleeve has different sensitivity to the factors.
Table 1.
| As of June 2024 | Single-Factor Sleeves of Developed Multi-Factor | |||||
| Size | Value | Momentum | Low Volatility | Profitability | Investment | |
| Supply Chain | 0.08 | 0.13 | 0.09 | 0.05 | 0.06 | 0.09 |
| Globalization | -0.16 | -0.17 | -0.05 | -0.22 | -0.08 | -0.19 |
| Short Rate | 0.02 | 0.13 | 0.13 | 0.04 | 0.05 | 0.07 |
| Term Spread | -0.01 | 0.07 | 0.07 | -0.11 | -0.02 | 0.00 |
| Breakeven Inflation | 0.12 | 0.14 | 0.14 | 0.02 | 0.03 | 0.07 |
The sensitivity of a factor sleeve to a given economic risk factor is the weighted average (using the stock weights within the sleeve) of underlying stock-level betas. These stock-level economic risk betas capture the sensitivity of stock returns more than the cap-weighted reference index to the returns of five market-beta neutral long-short portfolios that capture the five economic risks.
Our menu of economic risk factors is designed to capture recent economic disruptions that are likely to continue in the future, such as increased supply chain disruptions, surging trade tensions between Western countries and China, changes to monetary policy by central banks to manage growth and inflation risks, and increasing geopolitical risks such as the war in Ukraine or tensions in the Middle East. Given that these economic risks are not rewarded over the long term, investors might benefit from trying to get more neutral exposures to them relative to the cap-weighted benchmark, while still trying to maximize the exposures to consensus rewarded factors.
EconRisk to mitigate unintentional economic risks
To preserve the benefits of our diversified multi-factor strategy, we introduced a weighting scheme we call EconRisk. The weighting scheme is implemented separately on each factor sleeve. Weights of each single factor sleeve are allowed to move away from the diversified multi-factor strategy to minimize economic risks. We limit deviations to make sure we preserve the essential characteristics of each factor sleeve. The diversified multi-factor strategy is then the assembly of the six different single-factor sleeves.
The main benefit of the EconRisk weighting scheme is the improvement of the efficiency of our diversified multi-factor strategy. Indeed, by mitigating economic risks, we can eliminate unnecessary deviations relative to the cap-weighted benchmark that are not required to achieve the objective of stronger risk-adjusted performance over the long term, since economic risks are not rewarded. This allows us to capture the same exposure to rewarded factors — factor intensity or the sum of exposures to all six consensus rewarded factors — with lower deviations relative to the cap-weighted benchmark. This improved efficiency can be measured ex-post by looking at the factor intensity (Table 2) divided by the tracking error, which measures the deviations relative to the benchmark.
Table 2.
| Last 20-year | US | Developed Ex-US | Global | |||
| Multi-Factor | EconRisk | Multi-Factor | EconRisk | Multi-Factor | EconRisk | |
| Factor Efficiency | 18.1 | 19.4 | 18.6 | 18.9 | 26.9 | 28.9 |
The analysis is conducted from 30/06/2004 to 30/06/2024. Factor efficiency is measured as factor intensity divided by annualized tracking error. Factor intensity is the sum of rewarded factor exposures (except the market factor). Exposures to rewarded factors are measured via regressions, which are based on daily total returns. The Market factor is the excess return series of the cap-weighted index over the risk-free rate. Other factors are constructed from the return series of Market Neutral long/short portfolios formed by equally weighting stocks in the top/bottom three deciles of ranks for each factor criterion.
The risk-adjusted performance characteristics of our diversified multi-factor strategies are preserved, with Sharpe ratios being very similar across different regions, while we underscore a reduction of tracking error due the mitigation of economic risks and the subsequent reduction of unnecessary deviations relative to the cap-weighted benchmark.
Table 3.
| Last 20 years | US | Developed Ex-US | Global | |||
| Multi-Factor | EconRisk | Multi-Factor | EconRisk | Multi-Factor | EconRisk | |
| Ann. Returns | 10.66% | 11.01% | 8.29% | 8.05% | 9.72% | 9.83% |
| Ann. Volatility | 17.69% | 18.01% | 15.14% | 15.27% | 14.17% | 14.40% |
| Sharpe Ratio | 0.52 | 0.53 | 0.45 | 0.43 | 0.58 | 0.58 |
| Ann. Rel. Returns | 0.28% | 0.63% | 1.80% | 1.56% | 1.10% | 1.21% |
| Ann. Tracking Error | 3.99% | 3.40% | 3.06% | 2.88% | 2.97% | 2.59% |
| Information Ratio | 0.07 | 0.19 | 0.59 | 0.54 | 0.37 | 0.47 |
The analysis is conducted from 30/06/2004 to 30/06/2024 and is based on daily USD total returns. The SciBeta cap-weighted indices are used as benchmarks.
Another consequence of the mitigation of economic risks is the reduction of sector deviations relative to the cap-weighted benchmark. Even if our weighting scheme relies on stock-level information, we observe in the table below that, on average, over the last 20 years, sector deviations are reduced.
Figure 1.
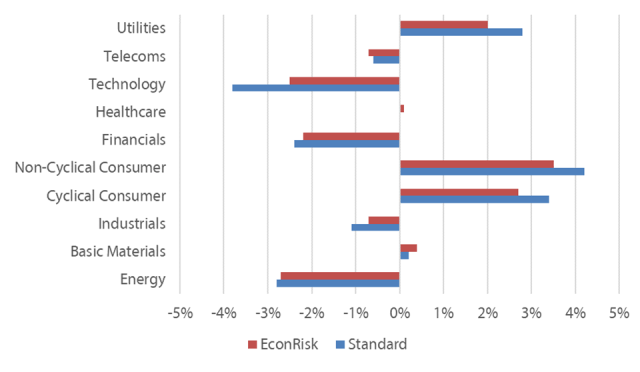
The analysis is conducted from 30/06/2004 to 30/06/2024 and is based on quarterly reviews allocations. Sector deviation is the average over the quarters of the difference between the sector allocation of the multi-factor index and the SciBeta cap-weighted index.
This approach also reduces extreme relative risks, which is the consequence of the reduction of deviations relative to the cap-weighted benchmark due to the mitigation of economic risks. Table 4 shows two different extreme relative risk metrics, the maximum relative drawdown, and the extreme relative returns defined as the worst 5% one-year rolling relative returns.
Table 4.
| Last 20 years | US | Developed Ex-US | Global | |||
| Multi-Factor | EconRisk | Multi-Factor | EconRisk | Multi-Factor | EconRisk | |
| Maximum Rel. Drawdown | 24.2% | 19.7% | 9.8% | 10.4% | 17.1% | 14.4% |
| Extreme Relative Returns |
-10.44% | -8.08% | -3.71% | -3.58% | -6.38% | -5.17% |
The analysis is conducted from 30/06/2004 to 30/06/2024 and is based on daily USD total returns. The Extreme Relative Returns corresponds to the 5% worst one-year rolling relative returns. The SciBeta cap-weighted indices are used as benchmarks.
Consensus rewarded factors are, by design, the main source of variations of the performance of multi-factor strategies. However, as Figure 2 shows, economic factors matter because they explain a substantial part of the difference in factor portfolio returns beyond what is explained by the market and consensus rewarded factors as seen in the table below.
Figure 2.
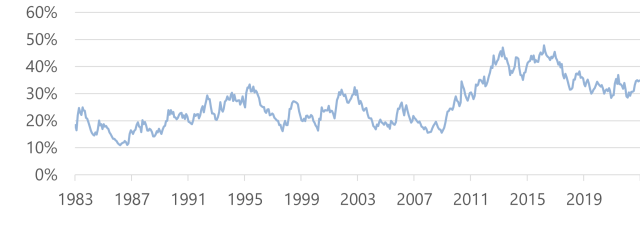
The figure displays the economic risk-driven dispersion across 32 factor portfolios. Economic risk-driven dispersion is the R2 from regressions of monthly portfolio return residuals on the available economic risk factor betas. Supply Chain and Globalization betas become available in June 2010. Monthly figures are smoothed with exponentially weighted moving averages having a half-life of six months.
Given the importance of economic factors on the short-term variability of factor portfolios’ returns, it is not acceptable for investors to ignore them in portfolio design. EconRisk is a robust portfolio construction approach to mitigate economic risks of diversified multi-factor strategies, while preserving their benefits, namely attractive expected returns, via strong exposure to rewarded factors and diversification of idiosyncratic risks.
Furthermore, our approach enables the reduction of unnecessary tracking error to improve the efficiency of diversified multi-factor portfolios by capturing stronger exposure to rewarded factors for the same level of deviation relative to the cap-weighted benchmark. The management of economic risks via this approach is a key source of value added for investors looking for diversified multi-factor portfolios.
References
Cochrane, J. (2005). Asset pricing. Princeton University Press.
Fama, E. and K. French (1995). Size and book‐to‐market factors in earnings and returns. The Journal of Finance 50(1): 131-155.
Markowitz, H. (1952). The utility of wealth. Journal of Political Economy 60(2): 151-158.
Zhang, L. (2005). The value premium. The Journal of Finance 60(1): 67-103.


