

Key point:
Strong rallies are generally followed by equally sharp declines. That is what happened with several altcoins, and Cardano (ADA) is no exception. Usually, the pullback shakes out the weak hands before resuming the uptrend.
Has ADA topped out in the near term, or is the dip a good buying opportunity? Let’s analyze the charts to find out.
Cardano price prediction
ADA broke above the $0.86 overhead resistance on Monday, but the bulls could not sustain the higher levels.
The price turned down sharply on Wednesday and plunged below the breakout level of $0.86. The bears pulled the price toward the 20-day simple moving average ($0.73) on Thursday, but the long tail on the candlestick shows solid buying at lower levels.
The bulls will try to challenge the overhead resistance of $0.94. If the level is crossed, the ADA/USDT pair could climb to $1.02 and later to $1.17.
Contrarily, if the price turns down and breaks below the 20-day SMA, it suggests that the breakout above $0.86 may have been a bull trap. The pair could then plunge to the 50-day SMA ($0.66).
Related: Bitcoin due ‘massive short squeeze' as BTC dominance bounces to 62%
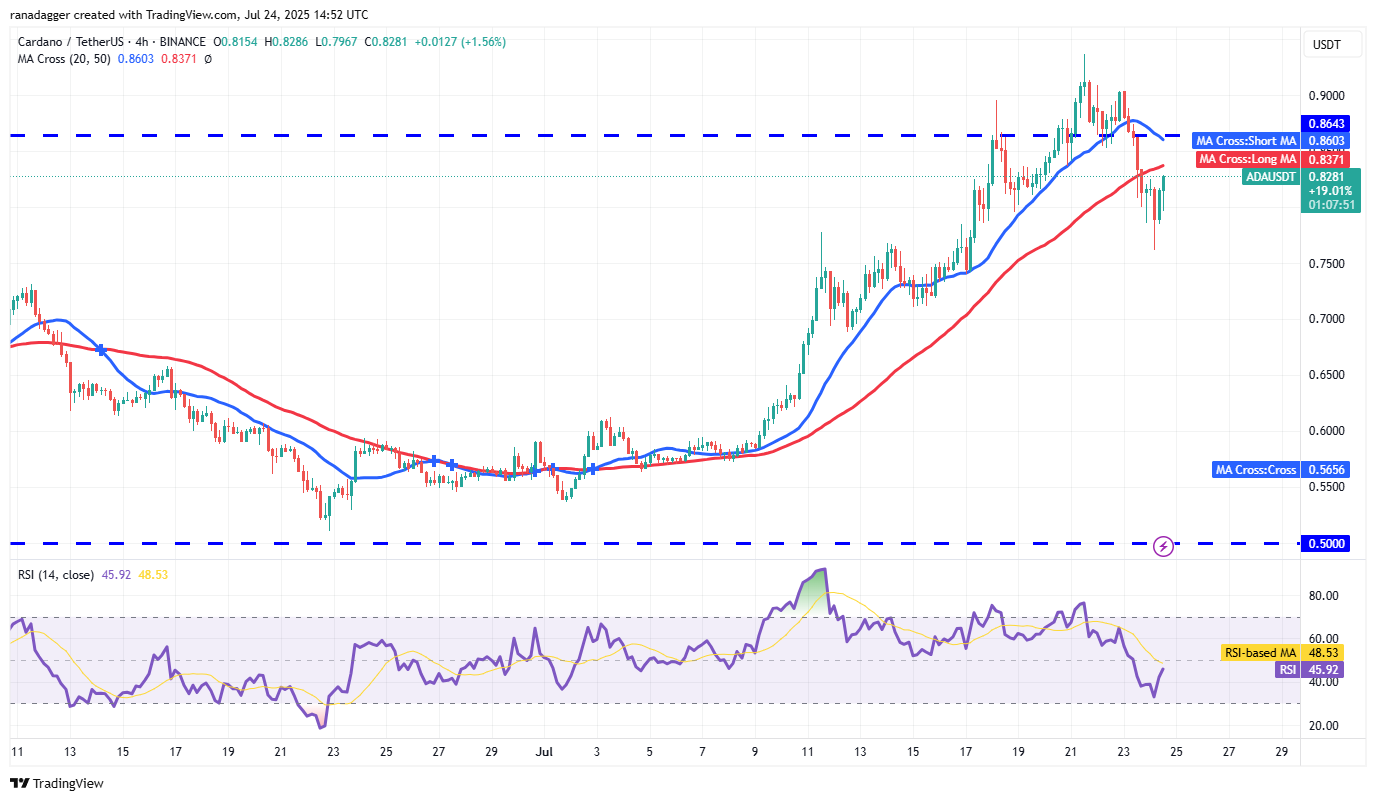
The moving averages are on the verge of a bearish crossover on the 4-hour chart, indicating a comeback attempt by the bears. Recovery attempts are likely to face selling at the 20-SMA.
If the price turns down from the 20-SMA, the pair could descend to $0.75 and later to $0.70. The deeper the fall, the greater the time it is likely to take for the next leg of the uptrend to begin.
Buyers will have to drive the price above the 20-SMA to get back into the driver’s seat. If they do that, the pair could rise to $0.90 and subsequently to $0.94.
This article does not contain investment advice or recommendations. Every investment and trading move involves risk, and readers should conduct their own research when making a decision.


