

Bear markets are notoriously nerve racking with each drawdown presenting its own set of unique circumstances. Yet history shows that staying invested through volatility is often critical to achieving long-term success. As the saying goes, volatility is the price you pay for long-term performance. Even the most severe bouts of volatility have not stood in the way of success for investors who maintained a long-term approach to investing.
This post provides data to help investors put bear markets in historical context and gain confidence in their long-term investment plans. To do that, we analyzed 15 bear markets since 1950, using the S&P 500 to compare recessionary and non-recessionary declines across three key dimensions — during both drawdowns and recoveries:
Magnitude and Duration of Drawdown
- Magnitude of non-recessionary bears is a shallower -22% compared to the median -35% drawdown felt when bear markets coincide with recessions.
- Duration of non-recessionary bears averaged only three months compared to 18 months for recessionary.
Monetary and Fiscal Policy Trends
- All the recessionary bear markets occurred with an inverted yield curve.
- In the only yield curve inversion where a recession was avoided, the deficit to GDP ratio increased by 3% during the period of fed tightening and curve inversion. This has also been true so far in current yield curve inversion period.
Investment Style Differentiation
- Low Volatility and Dividend styles were the most resilient in drawdowns regardless of whether recessionary conditions were present.
- Recovery performance in non-recessionary periods favored Quality and Growth compared to Value and Small Caps after recessionary bear markets.
Recessionary vs. Non-Recessionary
There are key differences in recessionary and non-recessionary bear markets.
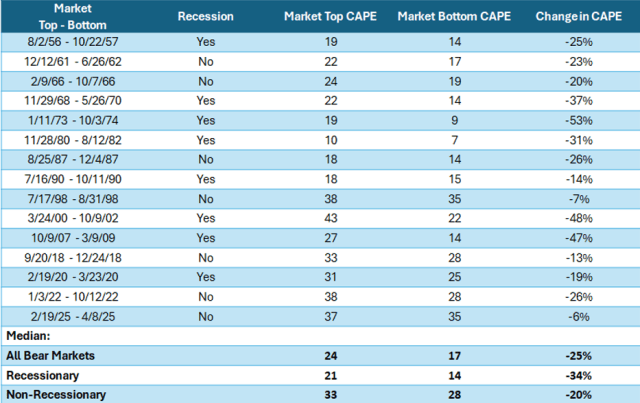
The median drawdown for recessionary bear markets was -35%, about 50% deeper than non-recessionary bears. Non-recessionary bear markets are usually caused by temporary fear that the economy is stalling or entering a recession. And as positive data emerges, the fear — and drawdown — subside. The additional 10% to 20% drawdown seems to coincide with evidence of recession finally surfacing in the data, additionally supported by an extra year of duration as it digests the negative data (not sentiment). Interestingly, there was only one time in history that we have experienced back-to-back, non-recessionary bear markets, and that was during the fiscally supportive 1960s.
Figure 1: Bear Markets by the Numbers
Disclosures: Please see appendix for definitions and citations.
Bear Markets Tend to Run Deeper When Valuations Are High
For our valuation measurement, we decided to use the CAPE ratio because trailing 12-month earnings are highly volatile during recessions, thus distorting the P/E ratio. For example, the 92% drop in earnings in 2008 didn’t reflect longer term views regarding what earnings were likely to be five to 10 years in the future, which is the foundation for point-in-time valuations.
We found valuation to be a terrible timing mechanism for both bear markets and recessions, but valuation did often factor into the severity of a bear market — with lofty valuations more often associated with severe bear markets.
The link between the severity of the recession and the depth of the bear market is questionable at best. For example, the 2000s bear market started with extreme valuation that was reduced by almost half by the time the market found a bottom. Notably, the 2000s bear market stands out because it had the smallest decline in real GDP of all the recessionary bears, yet it produced one of the longest and deepest drawdowns.

Another example of changes in valuation mattering to the severity of bear markets is the 1980 to 1982 drawdown. This was one of the most severe recessions and real GDP declines. However, the starting valuation was cheap, especially by today’s standards, resulting in a rather mild recessionary bear market decline of -27%.
Figure 2: Change in Valuation During Bear Markets
Disclosures: Please see appendix for definitions and citations.
Earnings and GDP Impact
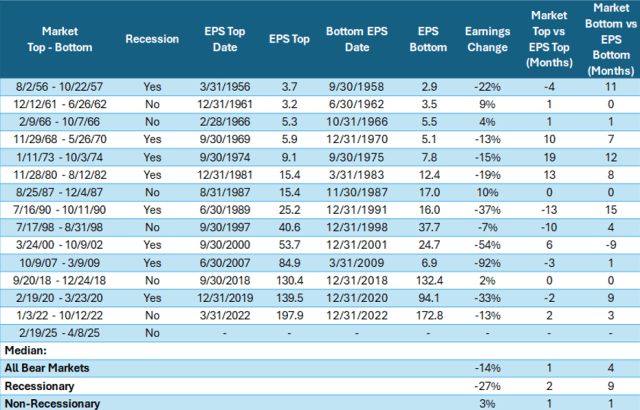
We took Shiller’s S&P 500 Earnings and analyzed the differences between recessionary and non-recessionary bears. The median earnings decline during recessionary bears was typically negative, corresponding with the shrinking economy. On the other hand, non-recessionary periods often had growing earnings.
Another interesting difference between recessionary and non-recessionary bear markets is where the market peaks and bottoms relative to earnings. Non-recessionary bear markets tend to peak and bottom relatively close with earnings. However, recessionary bears tended to bottom in advance of earnings by nine months.
Figure 3: Change in Earnings During Bear Markets
Disclosures: Please see appendix for definitions and citations.
Monetary and Fiscal Policy: Clues to Recession Risk
Fiscal and monetary policy also contribute to the severity of bear markets since they can influence the probability of recessions. The yield curve remains the most reliable predictor over horizons greater than one year, notes a Federal Reserve Bank of Chicago paper.
Fed hiking cycles are usually the culprit of yield curve inversions. We count 11 hiking cycles resulting in nine yield curve inversions and eight recessions with corresponding bear markets. The current hiking cycle and yield curve inversion is excluded because the cycle has not yet completed with a yield curve steadily in a positive sloping direction for at least two quarters.
The only time a yield curve inversion didn’t lead to a recession was in 1966, when the Fed was raising rates to fight inflation. At the same time, fiscal policy was expansionary, with the deficit-to-GDP ratio rising 3% due to simultaneous spending on the Great Society programs (Medicare and Medicaid) and the Vietnam War.
However, government spending increases to boost growth are often followed by an increase in prices, as we just saw post-Covid. In 1967, as inflation reaccelerated, the Fed began a second series of rate hikes leading to the recession and bear market of 1968 to 1970.
There are similarities today. Monetary policy has been restrictive but has been offset by government spending with a 3% increase in the deficit-to-GDP ratio. If the goal of Congress and the Administration is to get the budget deficit back down to 3% from its current 6% to 7% level, we will need to reduce the deficit by approximately $300 billion per year over the next four years. This would equate to a 1% drag on GDP per year, which would be growth negative in the short term but likely not recessionary on its own.
Whether the fiscal reduction is done through spending cuts, tax increases, or tariffs is less consequential than the immediate math of a 1% reduction in demand running through the economy. This is not a statement on medium-to-longer-run fiscal strategy’s impact on economic growth.
Which Investment Styles Hold up — and When
No matter the severity of the drawdown the market does recover. However, which styles you invest in matter during both the drawdown and recovery periods. In Figures 4 to 8, we present a series of quilt charts that suggest what investors should consider owning during and after both recessionary and non-recessionary bear markets.
It shouldn’t be a surprise that during bear markets in general, more conservative factors such as low volatility and dividend yield outperform, and more aggressive factors like high volatility and growth underperform. It also shouldn’t be a surprise that this scenario is reversed during market recoveries.
Figure 4: Style Excess Returns: Recessionary Bear Markets Top to Bottom
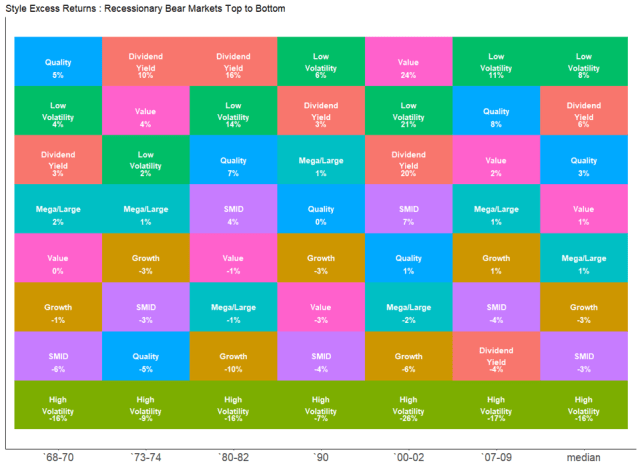
Disclosures: Past performance is no guarantee of future results. All the returns in the chart above are in reference to unmanaged, hypothetical security groupings created exclusively for analytical purposes. These are hypothetical styles based on describing characteristics. Please see appendix for definitions and citations. Excess Return is Annualized Return over the Top 1000 Portfolio.
Figure 5: Style Excess Returns: Non-Recessionary Bear Markets Top to Bottom
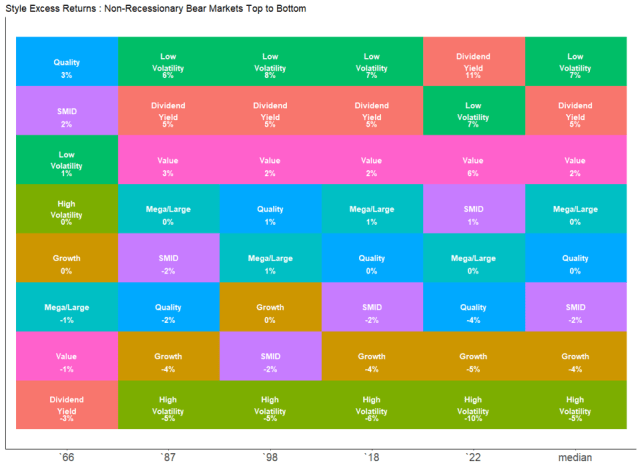
Disclosures: Past performance is no guarantee of future results. All the returns in the chart above are in reference to unmanaged, hypothetical security groupings created exclusively for analytical purposes. These are hypothetical styles based on describing characteristics. Please see appendix for definitions and citations. Excess Return is Annualized Return over the Top 1000 Portfolio.
One year after a recessionary bear market, the leading styles — aside from high volatility — are typically SMID and value. In contrast, the pattern following non-recessionary bear markets is markedly different: growth and quality tend to lead. This makes intuitive sense, as non-recessionary bears are often growth scares rather than full economic resets, so market leadership doesn’t shift. These periods typically align with the later stages of the economic cycle, when growth and quality styles historically outperform.
We limited Figure 7 to one year after the bottom of a non-recessionary bear. This was a decision made from necessity because approximately a year and half to two years after a non-recessionary bear, the market tends to experience a recessionary bear. Another indication that non-recessionary bears are mid cycle growth scares.
Figure 6: Style Excess Returns: 1-Year After Recessionary Bear Markets
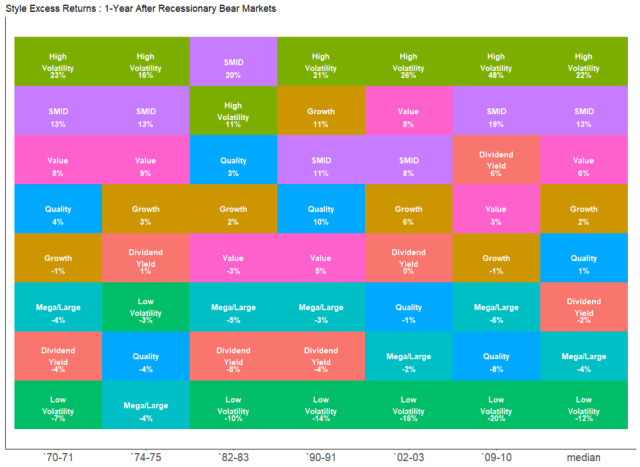
Disclosures: Past performance is no guarantee of future results. All the returns in the chart above are in reference to unmanaged, hypothetical security groupings created exclusively for analytical purposes. These are hypothetical styles based on describing characteristics. Please see appendix for definitions and citations. Excess Return is Annualized Return over the Top 1000 Portfolio.
Figure 7: Style Excess Returns: 1-Year After Non-Recessionary Bear Markets
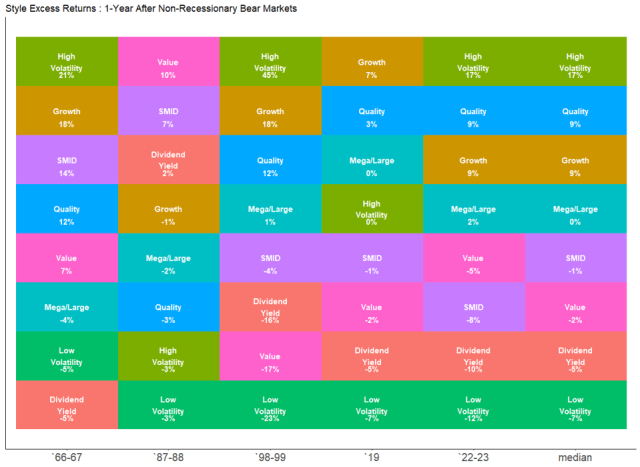
Disclosures: Past performance is no guarantee of future results. All the returns in the chart above are in reference to unmanaged, hypothetical security groupings created exclusively for analytical purposes. These are hypothetical styles based on describing characteristics. Please see appendix for definitions and citations. Excess Return is Annualized Return over the Top 1000 Portfolio.
When we dove a little deeper into the numbers across the entire cycle, we noticed interesting trends. In Figure 8, we show market cycles after recessionary bear markets. Recessionary bears follow the economic cycle and have a different pattern than non-recessionary bears. Unsurprisingly we see more cyclical styles such as value and small size lead in the first year of a new bull market. Value and small continue to lead, though at a more modest pace, in the second through fifth years of the new cycle.
Then, after the cycle reaches six years, we typically see a shift in leadership to the late cycle styles like growth and quality. As growth of the broad economy moderates after years of monetary and fiscal impulse typically seen in the early cycle, growth becomes more scarce with less companies able to demonstrate growth independent of the broad economy. This gives quality and growth a double barrel effect late cycle, combining better growth rates with multiple expansion (scarcity effect).
Figure 8: Historical Hypothetical Style Returns: Recessionary Bear Market Cycles
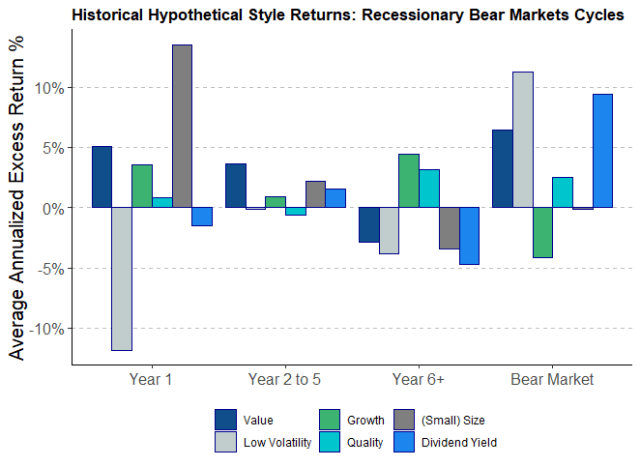
Disclosures: Past performance is no guarantee of future results. All the returns in the chart above are in reference to unmanaged, hypothetical security groupings created exclusively for analytical purposes. These are hypothetical styles based on describing characteristics. Please see appendix for definitions and citations. Excess Return is Annualized Return over the Top 1000 Portfolio.
In conclusion, if we avoid a recession, we can expect the worst of the volatility to be over and for quality and growth to continue to lead based on history. If we inevitably tip into a recession, we likely have lower and longer to go with low volatility, dividends and value historically helping reduce the pain. The subsequent rebounds from recessions have been historically good times to rebalance into the small- and mid-cap parts of the market.
This post aims to provide investors with historical data on bear markets to offer perspective and build confidence in long-term investing. Bear markets are the price we pay for the remarkable compounding potential of equities. By better understanding where we are in the economic cycle — and what type of bear market cycle we may be experiencing — investors and advisors alike can use historical patterns to manage expectations, navigate uncertainty, and position portfolios for both resilience and recovery.
Appendix & Citations
Figures 1-3: Bear Market Data Tables
- S&P 500 Index Levels. FactSet, 2025.
- Blinder, Alan. 2023. “Landings, Soft and Hard: The Federal Reserve, 1965-2022.” Journal of Economic Perspectives—Volume 37, Number 1—Winter 2023—Pages 101–120
- Federal Reserve Bank of New York. The Yield Curve as a Leading Indicator. https://www.newyorkfed.org/research/capital_markets/ycfaq.html.
- Shiller, Robert J. Online Data: U.S. Stock Markets 1871–Present and CAPE Ratio. Yale University Department of Economics, http://www.econ.yale.edu/~shiller/data.htm.
- National Bureau of Economic Research. US Business Cycle Expansions and Contractions. https://www.nber.org/research/data/us-business-cycle-expansions-and-contractions.
- US Bureau of Economic Analysis, Real Gross Domestic Product [GDPC1], retrieved from FRED, Federal Reserve Bank of St. Louis; https://fred.stlouisfed.org/series/GDPC1, May 1, 2025.
- Kelley, David. 2019. Which Leading Indicators Have Done Better at Signaling Past Recessions? Chicago Fed Letter No. 425. Federal Reserve Bank of Chicago. https://www.chicagofed.org/publications/chicago-fed-letter/2019/425.
Figures 4–8: Quilt Charts and Market Cycles Chart
- Data Source: Compustat
- Calculation: Hartford Equity Modeling Platform
Style and Time Period Definitions:
- Value: US Top 1000 Stocks top 30% based on Composite Value as defined by multiple equally weighted valuation metrics to arrive at an aggregated valuation metric. Valuation metrics include P/E, EBITDA/EV, Operating Cash Flow/EV, Revenue/EV, and B/P Yield (used only in financials and real estate as a replacement to EBITDA/EV), then cap weighted.
- Low Volatility: US Top 1000 Stocks top 30% based on a Composite Volatility score defined by multiple equality weighted volatility metrics to arrive at an aggregated volatility metric. Volatility metrics include 3 Year weekly Beta and 6-month daily Std Deviation, then cap weighted.
- High Volatility: US Top 1000 Stocks bottom 30% based on a Composite Volatility score defined by multiple equality weighted volatility metrics to arrive at an aggregated volatility metric. Volatility metrics include 3 Year weekly Beta and 6-month daily Std Deviation, then cap weighted.
- Dividend: US Top 1000 Stocks top 30% based on trailing 12month dividend per share divided by current share price, then cap weighted.
- Quality: US Top 1000 Stocks top 30% based on Gross Profits to Assets, then cap weighted.
- Growth: US Top 1000 Stocks top 30% based on 5 Years Sales Growth, then cap weighted.
- SMID: US Mid-sized & Small Cap stocks representing the smallest 15% and 13% of stocks respectively, excluding the very smallest 2% which are classified as microcap, then cap weighted.
- Mega/Large: US Mega & Large Market Cap stocks with Mega representing the largest 40% and large cap representing the next largest 30% of the universe, then cap weighted.
- Top 1000: US Top 1000 Stocks, cap weighted.
Period Definitions for Market Cycles Bar Charts:
- Recessionary Bear Markets
- Year 1: The 12 months directly following a bear market period. Years 2-5: Months 13-60 following the preceding bear market. Year 6+: The period after month 60 until the next bear market
- Bear Market: Any period when the US Market dropped by 20% or more with a corresponding recession
*It is important to note that we defined bear markets as -19% or greater declines from all-time highs, given the unusually large amount of -19% declines and clients rightly are as anxious to lose -19% as -20%.


