
By ATGL
Updated July 4, 2025
Technical patterns provide traders with visual representations of market psychology and price action dynamics. The three drives pattern stands out as a sophisticated tool for identifying potential trend exhaustion and capturing major market moves. This pattern combines precise Fibonacci relationships with time symmetry to signal high-probability reversal opportunities.
Understanding how to identify, confirm, and trade this pattern can significantly enhance your ability to capitalize on major market transitions. This guide will explore the pattern’s structural components, reveal the Fibonacci levels that define its formation, and provide actionable strategies for incorporating it into your trading approach.
What Defines the Three Drives Pattern?
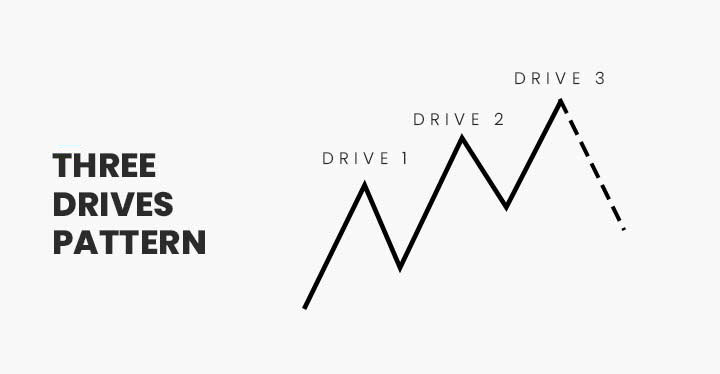
The three drives pattern consists of three consecutive price movements in the same direction, each separated by corrective retracements. These drives create a harmonic relationship where each successive move extends beyond the previous one, forming a pattern that signals potential trend exhaustion. The pattern derives its predictive power from the mathematical precision of Fibonacci ratios and the time symmetry between each drive.
Each drive within the pattern follows specific Fibonacci extension levels, typically reaching 127.2% or 161.8% of the previous corrective move. The retracements between drives usually fall within the 61.8% to 78.6% Fibonacci range, creating a balanced rhythm that reflects natural market cycles.
The pattern manifests in two primary variations: bullish and bearish configurations. A bullish three drives pattern forms at the bottom of a downtrend, where three successive lower lows create the foundation for an upward reversal. Conversely, a bearish three drives pattern emerges at the top of an uptrend, with three higher highs setting the stage for a downward correction.
The three-way drive pattern represents the same concept but emphasizes the three-part structure that defines this formation. What distinguishes this pattern from a simple triple top or triple bottom is the progressive nature of the price movements, with escalating extremes that eventually exhaust the prevailing trend.
Top Fibonacci Levels Involved in the Three Drives Pattern
The mathematical precision of Fibonacci ratios forms the backbone of three drives pattern analysis. The most significant extension levels include 127.2%, 161.8%, and occasionally 200% of the corrective moves. Drive extensions typically follow a progressive pattern where the second drive extends to 127.2% of the first corrective move, while the third drive reaches 161.8% of the second correction.
Retracement levels between drives usually fall within the 61.8% to 78.6% range, with 70.7% representing a common intermediate level. The AB=CD relationship often appears within the pattern, where the price and time relationships between the first two drives mirror those of the final drive.
Bullish vs Bearish Three Drives Pattern
Bullish three drives patterns develop during downtrends when selling pressure gradually exhausts itself through three successive lower lows. Each drive down represents a renewed attempt by sellers to push prices lower, but diminishing momentum signals weakening conviction.
Bearish three drives patterns form during uptrends through three consecutive higher highs that eventually exhaust buying pressure. Triple top patterns, while superficially similar to bearish three drives patterns, show three relatively equal highs rather than progressively higher highs. This distinction makes the three drives pattern inherently bearish at completion, while a triple top may indicate consolidation.
How To Confirm the Three Drives Pattern Using Indicators: Key Tips
Successful three drives pattern trading requires confirmation from multiple technical indicators. The Relative Strength Index (RSI) provides valuable insight through divergences between price and RSI during pattern completion. When price makes a new extreme during the third drive while RSI fails to confirm, this divergence strengthens the reversal signal.
The Moving Average Convergence Divergence (MACD) indicator offers confirmation through diminishing momentum with each successive drive. Volume analysis plays a crucial role, as declining volume during successive drives suggests weakening participation in the prevailing trend.
The integration of technical stock analysis techniques with pattern recognition creates a more robust trading framework. Entry points typically occur after the third drive completes and shows initial signs of reversal. Stop-loss placement requires careful consideration, with conservative approaches placing stops beyond the third drive’s extreme.
Trading Strategies for the Three Drives Pattern
Reversal trading represents the primary strategy for three drives pattern implementation. This approach involves entering positions in the opposite direction of the completed pattern, anticipating a significant trend change. Position sizing becomes critical due to the inherent uncertainty of timing market turns.
Risk management techniques must account for the pattern’s inherent volatility. Many traders risk no more than 1%-2% of their account on individual three drives pattern trades. The integration of trading patterns knowledge helps traders recognize when patterns might be part of larger formations.
Common Mistakes When Trading the Three Drives Pattern
Premature pattern identification represents one of the most frequent errors. Many traders assume a pattern is complete without waiting for proper confirmation or verifying the mathematical relationships. Ignoring market context creates another significant pitfall, as the pattern’s effectiveness varies considerably depending on overall market conditions.
Inadequate risk management frequently undermines otherwise sound pattern recognition. Over-reliance on automated indicators without understanding underlying market dynamics creates additional problems. The misconception that all three drives patterns produce equal results leads to unrealistic expectations and poor trade management.
Market Context Matters: How It Shapes the 3 Drives Pattern
Overall market trends significantly influence three drives pattern reliability. Patterns that form in the direction of the primary trend tend to be less reliable for reversal trading. Volatility levels affect both pattern formation and subsequent price movements, requiring adjustments to traditional Fibonacci level expectations.
Market sentiment and news events can override technical pattern signals, particularly during major economic announcements. The relationship between different asset classes affects pattern reliability across markets, requiring traders to maintain awareness of cross-market relationships.
Using the Three Drives Pattern Indicator
Automated three drives pattern indicators can streamline pattern identification, scanning multiple markets simultaneously for potential formations. These tools provide consistent criteria for pattern recognition but have limitations in assessing market context or evaluating formation quality.
The integration of automated indicators with manual analysis creates an optimal approach. Regular back testing helps traders understand indicator strengths and limitations. The combination of pattern indicators with other technical analysis tools, including popular trading patterns recognition, creates comprehensive trading systems.
Take Control of Your Trading With Pattern Recognition
Mastering the three drives pattern requires understanding both its technical components and market applications. The pattern’s mathematical foundation provides objective criteria for identification, while its harmonic relationships offer insights into market psychology and timing.
Successful pattern trading requires continuous learning and adaptation. The relationship between three drives patterns and other formations, such as the spike chart pattern, provides additional context for understanding market dynamics.
For traders seeking to enhance their pattern recognition skills and access advanced trading strategies, Above the Green Line’s membership program offers comprehensive resources and ongoing support. By joining a community of serious traders and accessing professional-grade analysis tools, you can take your three drives pattern trading to the next level and improve your overall market performance.
Related Articles


")

