

By ATGL
Updated July 4, 2025
Spotting market reversals is crucial for traders aiming to maximize profits, and technical patterns serve as invaluable tools in this endeavor. Among these, harmonic patterns stand out for their specialized approach, employing geometry and Fibonacci ratios to predict potential turning points in the stock market. This precise and methodical technique can tip the scales in a trader’s favor by highlighting when a trend may be poised to pivot.
Harmonic patterns, such as the Gartley, Bat, Butterfly, and Crab, are essential setups that traders should understand and leverage. Each of these patterns offers unique entry and exit points, enhancing a trader’s ability to read market movements accurately. While learning to identify these formations may seem daunting at first, mastering them can significantly improve trading outcomes.
In this article, we will delve into the specifics of these popular harmonic patterns, exploring how to spot them on stock charts and craft entry and exit strategies effectively. We’ll also discuss how using harmonic patterns can help traders avoid false signals and improve trading accuracy, detailing why they deserve a place in every trader’s toolkit.
How Harmonic Patterns Work in the Stock Market
Harmonic patterns are tools in technical analysis that help traders identify potential market turning points. These patterns use geometric shapes and Fibonacci ratios to forecast price reversals. By analyzing price movements, traders can spot opportunities for entry and exit points. Common harmonic patterns include the Gartley, Bat, Crab, and Butterfly patterns. In this section, we’ll explore how traders identify these patterns and use them in trading strategies.
The Role of Fibonacci Ratios in Pattern Formation
Harmonic patterns rely on Fibonacci ratios to predict market changes. These ratios, based on the Fibonacci sequence, help traders identify price levels where reversals might occur. Patterns are formed by combining time, price, and these specific ratios.
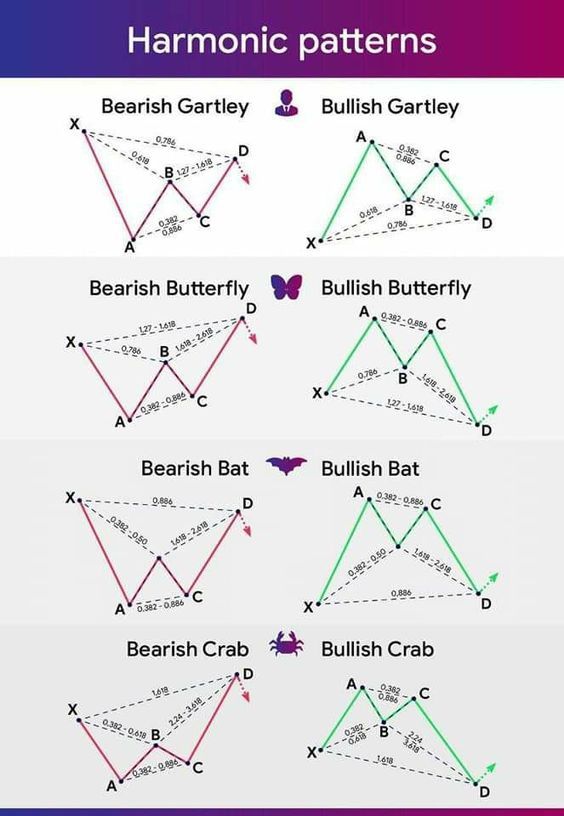
Fibonacci retracements and extensions play a crucial role in defining harmonic patterns. For example, a Gartley pattern may use the 0.618 retracement, while a Bat pattern might focus on the 0.886 retracement. Extensions like 1.27 or 1.618 are also common in patterns such as the Crab. These precise ratios help traders spot Potential Reversal Zones.
Popular Harmonic Patterns Traders Should Know
Harmonic trading uses chart patterns to predict price movements. These patterns help traders find potential reversals by blending geometry and Fibonacci ratios. They create a “Potential Reversal Zone” where the price may change direction. In this section, we’ll introduce some common harmonic patterns. Each pattern has its own structure and trading strategy, making it essential for traders to know their differences.
The seven main harmonic patterns include the Gartley, Bat, Butterfly, Crab, Shark, Cypher, and ABCD patterns. Each pattern uses unique combinations of geometric shapes and Fibonacci levels. Traders often ask which pattern is most effective. The answer depends on market conditions and trading style. However, the Gartley and Bat patterns are often favored due to their frequency and reliability. Understanding these patterns can be a valuable part of a trader’s toolkit. Now, let’s explore the individual patterns in more detail.
Gartley Pattern: A Setup for Reversals
The Gartley Pattern is a popular tool among traders. It helps identify potential reversals in the market. This pattern forms when price movements create a symmetrical “M” or “W” shape. The key is to use Fibonacci ratios to mark the reversal points. Traders look for specific retracements and extensions within the pattern. This includes the use of the 61.8% and 78.6% levels.
The pattern consists of four legs: XA, AB, BC, and CD. These legs represent different price swings on a chart. The Gartley setup is used to enter trades at the reversal zone of the CD leg. The goal is to predict a price change and profit from the upcoming trend direction. Many traders rely on this pattern for its accuracy when combined with other indicators. Using it correctly can enhance trading success.
Bat Pattern and Its Strategic Use in Trading
The Bat Pattern is another reliable harmonic setup. It is similar to the Gartley pattern but with key differences in Fibonacci levels. The Bat pattern offers traders an edge by identifying precise entry and exit points. It forms through four legs, XA, AB, BC, and CD, like other harmonic setups. However, the Bat pattern’s D point falls at a deeper Fibonacci retracement, typically 88.6% of the XA leg.
Traders value the Bat pattern for its accuracy in pinpointing reversals. When the pattern completes, it suggests a strong turning point in the market. This makes it a strategic tool for forex and stock traders alike. To trade the Bat pattern effectively, it is crucial to confirm the setup with other signals. Some traders use candlestick patterns or moving averages for added confidence. Combining these tools can increase the chances of a successful trade.
Butterfly and Crab: Advanced Harmonic Setups
The Butterfly and Crab patterns are advanced harmonic setups. These patterns allow traders to anticipate significant price moves. Both patterns extend beyond the starting point of their initial XA legs, unlike the Gartley and Bat patterns. This characteristic often signals powerful reversals.
The Butterfly pattern ends at an extension of the XA leg, usually hitting the 127.2% or 161.8% Fibonacci levels. Traders use this pattern to find high-probability reversal areas. The Crab pattern is known for its extreme precision. It completes with the D point at a 161.8% extension. This pattern might take longer to form but can result in substantial price changes.
These advanced patterns require practice to master. They demand careful attention to Fibonacci levels and geometric proportions. Experienced traders often rely on pattern recognition software to spot these setups accurately. Both the Butterfly and Crab patterns can offer significant trading opportunities. By understanding them, traders can better navigate complex market environments.
For those focused on shorter-term strategies, harmonic setups can complement day trading patterns by adding an extra layer of confirmation for quick trade decisions. They also work well when combined with other stock trading patterns to enhance entry and exit accuracy.
How To Identify Harmonic Patterns on Stock Charts
Stock charts are the canvas for technical analysis, helping traders visualize price action, identify patterns, and make informed decisions with confidence. Technical patterns help traders spot when the market might change direction. Harmonic patterns are a special type of pattern. They use geometry and Fibonacci ratios to predict these changes. Let’s explore how you can identify them.
First, look for geometric shapes on price charts. These shapes include the Gartley, Crab, Bat, and Butterfly patterns. Use the Fibonacci retracement tool to verify these patterns. Key Fibonacci ratios such as 0.618 and 1.618 will help confirm the shape.
Here’s how you can spot these patterns:
- Gartley Pattern: Look for M or W shapes. Check if the Fibonacci levels match 0.618 or 0.786 retracements.
- Crab Pattern: Identify extended wave legs with 1.618 Fibonacci extensions.
- Bat Pattern: Similar to Gartley, but with deeper retracement levels.
- Butterfly Pattern: Look for patterns ending in the 1.272 extension level.
Utilize charting software and pattern recognition tools to recognize these formations. Set profit targets and manage risk effectively with stop-loss orders. Detecting harmonic patterns visually and technically can enhance your trading strategy.
Entry and Exit Strategies for Harmonic Pattern Trades
Technical patterns help traders spot potential market reversals. Harmonic patterns are a specialized method that uses geometry and Fibonacci ratios to predict turning points.
Entry and Exit Strategies for Harmonic Pattern Trades
Traders use harmonic setups to determine entry, stop-loss, and target zones. Here are some key points:
Entry Points:
- Confluence: Look for the overlap of Fibonacci levels and geometric shapes.
- Price Action Confirmation: Wait for a candlestick pattern to confirm the trade.
Stop-Loss Orders:
- Place stop-losses just beyond the reversal zone to limit risk.
Profit Targets:
- Use Fibonacci extensions to set realistic targets.
Profitability of Harmonic Patterns
Are harmonic patterns profitable? Yes, if used with strong risk management and strategy. Proper confluence, along with favorable risk-reward ratios, can enhance profitability.
| Steps | Key Tools |
| Identify Pattern | Geometric shapes |
| Confirm with Fibonacci | Fibonacci retracement tool |
| Set Entry & Exit | Price action and extensions |
Adding these layers of analysis can help improve your trading decisions. Use this approach to make informed trades while managing risks effectively. When combined with broader trends like stock market seasonality, harmonic patterns can offer even greater insight into timing trades during recurring market cycles.
Avoiding False Signals and Improving Accuracy
Technical patterns help traders spot potential market reversals by analyzing price movements. Harmonic patterns are a specialized method using geometry and Fibonacci ratios to predict these turning points. They incorporate precise patterns like the Gartley, Crab, Bat, and Butterfly, each identified using Fibonacci retracements and extensions.
To avoid false signals and improve accuracy, traders should consider the following:
- Volume Confirmation: Ensure that changes in price are supported by high volume. If a pattern forms with low volume, it might signal a false positive.
- Trend Alignment: Confirm that the pattern aligns with the broader market trend. Patterns that go against the trend could be less reliable.
- Supporting Indicators: Use indicators like RSI and MACD to add confidence. For instance, an RSI above 70 or below 30 can confirm an overbought or oversold condition.
| Indicators | Purpose |
| RSI | Identifies overbought or oversold conditions |
| MACD | Shows trend changes |
By integrating these strategies, traders can filter out low-probability setups and focus on stronger opportunities. Additionally, employing stop-loss orders and risk management can further guard against potential losses.
Why Harmonic Patterns Belong in Your Trading Toolkit
Technical patterns help traders spot potential market reversals. Harmonic patterns are a specialized approach that uses geometry and Fibonacci ratios to predict turning points. These patterns offer detailed entry points and profit targets in trading. Harmonic patterns are a powerful addition to a trader’s toolbox and can complement a wide range of investment strategies, especially those focused on precision entry and exit points.
Why Include Harmonic Patterns?
- Precision: They use Fibonacci ratios to identify Potential Reversal Zones (PRZ).
- Variety: Common patterns include the Gartley, Bat, Crab, and Butterfly patterns.
- Risk Management: Clear entry and exit signals help manage risks effectively.
How to Identify Harmonic Patterns:
- Use Fibonacci retracement and extension tools.
- Look for specific geometric shapes.
- Apply Pattern Recognition Software for accuracy.
Trading Harmonic Patterns Effectively:
- Set stop-loss orders at the PRZ.
- Align with candlestick patterns for confirmation.
- Employ Fibonacci levels to establish profit targets.
These patterns provide a structured trading strategy. They help traders make data-driven decisions.
To maximize your trading potential, consider adding harmonic patterns to your toolkit. Discover the power of precision and timing today! Start enhancing your trading strategy with harmonic stock patterns. Don’t miss out on potential market reversals—act now to refine your trading skills! Join Above the Green Line today and get access to expert tools, training, and real-time trade alerts designed to elevate your performance.
Related Articles