

Style regimes constitute one of investors’ largest risk factors, second only to overall equity exposure. After 15 years of growth style dominance, the return of intra-market volatility has prompted renewed interest in style framework and cyclical rotations. By reacquainting ourselves with the dynamics of style cycles, we can better understand how these portfolio building blocks shape our financial futures.
In this analysis, I will demonstrate that style returns are the market’s veritable gulf stream, and investors should not ignore their powerful currents. I will address three basic yet fundamental questions:
1. What is the typical duration of growth and value style regimes?
2. How impactful are oscillations between growth and value?
3. What are the mechanics of style transition?
With its three simple, yet powerful inputs, I believe the Russell Style methodology can unravel some of the market’s most resonating behaviors.
What is the typical duration of growth and value style regimes?
With the sharp 2022 rotation to value stocks fresh in the memory, investors want to know whether rotations are transitory movements or durable market trends. To provide context and guidance, I measured the ratio of the total returns of the Russell 1000 Growth and Value Indexes from December 1978, rebased to 100 as an initial value.
This methodology allows us to observe distinct periods of outperformance by either growth or value without distraction from the runaway compounding of equity returns. The approach is time-agnostic: cross-period comparisons, such as between the 1980s and the 2010s, can be made on a roughly equivalent basis.
Depiction of Russell 1000 Growth Index total returns divided by Russell 1000 Value Index total returns, parity set to 100 with an inception date of December 31st, 1978. Source: FTSE Russell Data, February 2024.
By connecting peaks and troughs in the chart above, 10 discrete periods of style performance can be readily identified. Upward surges indicate the outperformance of growth, whereas downward trends reveal a rotation toward value. What is fascinating is that such clear cyclical patterns emerge, even though month-over-month style returns continue in the same direction only 51.9% of the time — a rate indistinguishable from a coin toss!

Some model judgements are necessary in assigning style regimes. For example, regimes five and six are separated instead of counting one combined growth regime during the 1990s, because these two phases are more distinct from each other than growth and value are on average. Notwithstanding such discretionary calls, this framework offers an evidence-based approach to breaking down the wave function of style returns.
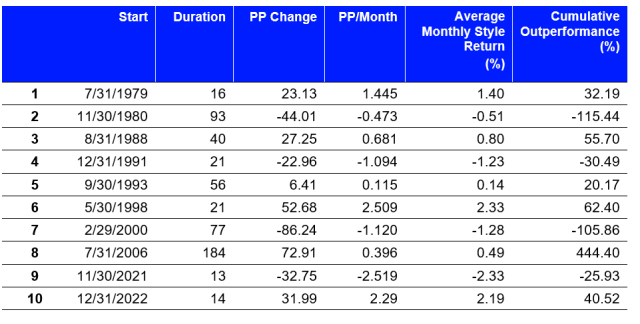
Four different measures of trend size and intensity are depicted. PP Change denotes the percentage point change in the ratio of Russell 1000 Growth and Value Index total returns during each regime. Column PP/Month is the rate of change in the previous value and is the average slope for each regime. Regime 10 is still in phase and does not signify a completed regime. Source: FTSE Russell, February 2024.
The average duration of style regimes is 64 months, but there is far more nuance than this headline number would suggest. First, there is a high dispersion in regime length, ranging from 13 months at the short end (regime nine) to 184 months at the long end (regime eight), a spread of more than one order of magnitude.
In fact, the 15-year Great Growth Regime (GGR, regime eight), which lasted from July 2006 to November 2021, is a true outlier that skews the overall results. Notably, regime eight lies 2.3 standard deviations out from the mean regime length (4.6 if excluded from sample).
We arrive at a more representative understanding of style regime length by isolating the impact of the 15-year GGR. The overall average cycle length decreases to 46 months, and the average duration of growth regimes is nearly halved to 33 months. Hence, we can conclude that style regimes are not flavor of the month phenomena, but rather they are generally multi-year trends. Furthermore, when excluding the GGR, value regimes tend to persist for twice as long as their growth brethren.
How impactful are oscillations between growth and value?
After 44 years, the annualized returns of these antithetical strategies differed by only 42 basis points, and growth and value achieved return parity as recently as March 14, 2023. If both style methodologies take investors to roughly the same destination, just how significant are style trends? Are they mere ripples on the overall surface of equity returns?
It is more appropriate to talk of powerful waves: the oscillations between growth and value carry tremendous impact. Calculating the rates of change in the ratio of growth and value total returns shows that style trends progress on average at a rate of 1.15 percentage points per month (pp/m).
For context, this style trend velocity is 44% greater than the expected monthly returns for equity markets, while progressing at only 55% of the latter’s volatility. This analysis demonstrates that style trends are both more forceful and more consistent than those of the underlying equity market. In sum, these gyrations equate to $600 billion in shareholder wealth being reallocated between growth and value each month.
While the average style regime sees a 40.9 percentage point swing in the ratio of growth/value total return, there is great variance in the pacing of style returns at the regime level. Historically, value regimes have progressed 26% more quickly than their growth counterparts, owing to rapid value reversions after growth trends culminate.

Excluding the mid-1990s style neutrality of regime five with its progression rate of only 0.12pp/m, the GGR was the least dynamic style trend, progressing at only 0.39 pp/m. Compare this slow pacing with the next value cycle (regime nine in the table) which was the most aggressive on record, surging at a negative 2.52pp/m clip. This reversal of style direction after a 15-year steady state, as well as a sixfold intensification of style, contributed to the market whiplash sensation experienced by many equity investors in 2022.
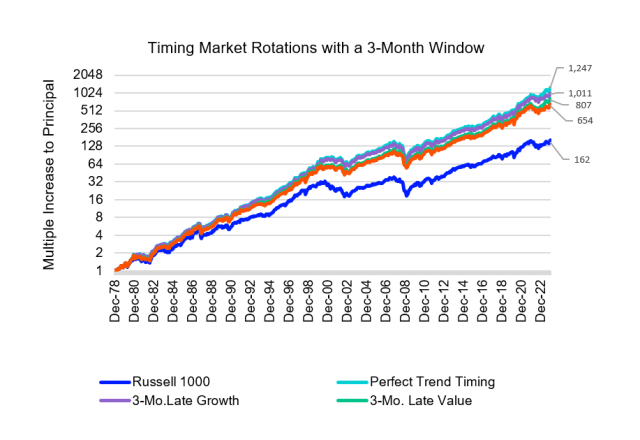
Perfectly timing these 10 Russell style regimes would have meant a near sevenfold increase to base index returns since 1979, catapulting investor gains from a 162 times increase to a staggering 1,247 multiple of initial principal. Even if investors had missed these transitions by a 3-month lag, they could still have captured a fourfold increase to the Russell 1000 Index return, appreciating 653 times. By contrast, a supremely unlucky investor consistently out of phase with the prevailing style trend would have achieved only 10.5% of the benchmark’s gains. Simply put, style allocations matter — but how can investors profit from these key moments in style transition?
What are the mechanics of style transition?
The primary distinction between the growth-to-value and the value-to-growth transitions lies in their dynamism. Rotations into value are consistently far more dramatic events, with 5.57 times the market style displacement on average. This value is calculated by measuring the total change in the ratio of growth and value total returns in the three months preceding and following each style maxima or minima. In essence, it captures how much ground the market covered from a style perspective during the transition.
The unambiguous conclusion is that unlike attenuated, U-shaped shifts into growth, rotations into value are fairly violent market events. Whereas investors have time and opportunity to assess risk and reposition as growth returns to favor, they have no such luxury with reversions to value.
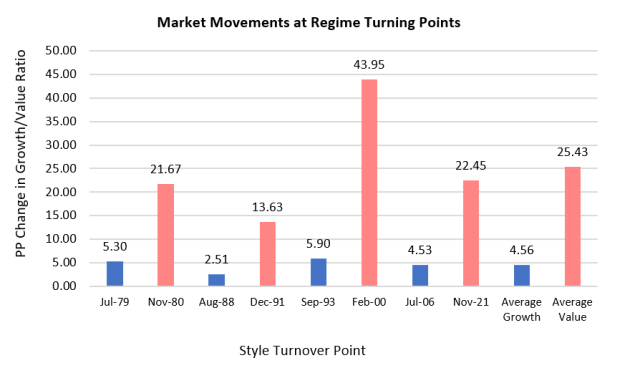
Total market displacement (absolute value) at each style regime transition point, 3 months leading and following the extrema, expressed in percentage point change in the ratio of Russell 1000 Growth to Russell 1000 Value Index total returns. Blue indicates growth regimes, rose value regimes. Source: FTSE Russell, February 2023.
Why is there such a disparity in rotation intensity? It stems from a fundamental characteristic of all growth regimes — they spike in returns as the style trend culminates. No growth cycle has ever ended without this final bout of exuberance. Indeed, the last 20% of a growth trend captures 50.8% of the style returns. The risk lovers among us can rejoice, as in these growth climaxes, style returns accrue at 6.23 times the rate recorded during the remainder of the regime.
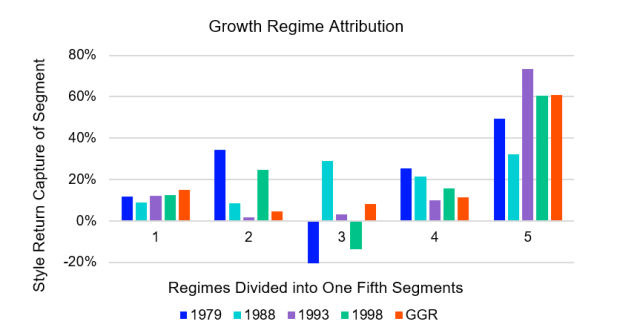
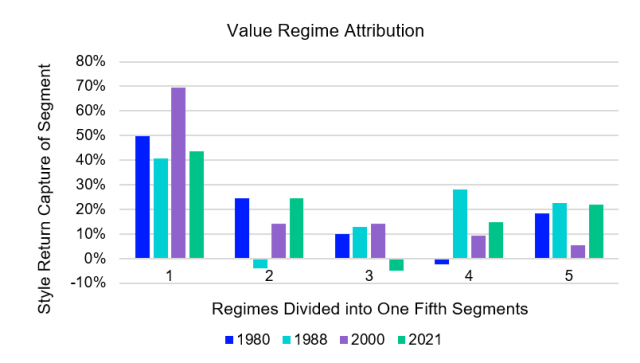
Growth and value regimes are segmented into one fifth buckets by time progression, illustrating their capture rate of total regime style returns. Source: FTSE Russell, February 2024.
Perhaps as striking as the regularity and predictability of these growth flares, is the symmetry of the ensuing growth collapse and value resurgence. Just as growth regimes see their style returns back-loaded in the cycle, value regimes are front-loaded to the same proportion of 50.8%.
Not only does this terminal growth spike create a pattern that reverberates through the history of style cycles, but it also suggests the lead into a market rotation is predictive of the intensity of the departure into the next cycle.
Moreover, we can use the lens of volatility to corroborate this U- versus V-shaped framework of growth and value style transitions. An assessment of the six months encapsulating each style rotation finds that shifts to growth occur with market volatility and style volatility 1.4 points below average, while transitions to value see these volatility measures increases by 0.9 and 3.6 points, respectively.
For added context, these figures signify that growth transitions fall at the 48th percentile for style trend volatility, while shifts to value reach the 86th percentile. In other words, shifts from value to growth and shifts from growth to value are two different animals entirely.
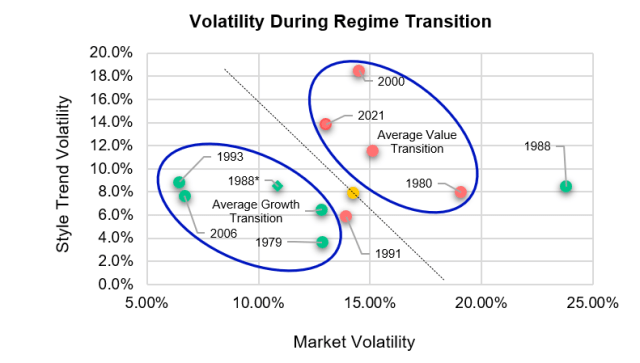
Green points connotate growth regimes, red value cycles. Data observations based on averaged volatilities during the 7 months encompassing each transition point (3 months prior to, the month of transition and 3 months trailing). Source: FTSE Russell Data, February 2024.
Style to Your Advantage
Style cycles are durable, multi-year trends that represent a powerful undertow beneath the surface-level returns of equity markets. Given the importance of style returns and their associated volatility patterns, the most risk-efficient way to benefit from style transition is to aggressively allocate to value after a corresponding regime change.
Not only do these style transitions provide clear market signals when they occur, but value style returns experience an early cycle concentration, and decrease in intensity as they progress. Moreover, the eventual rotation back to growth has historically been a gradual affair, diminishing the investor’s risk to over or undershooting the style transition.
To further generational understanding of growth and style methodologies, as well as their practical applications, I have written three papers in a series of four, available on FTSE Russell’s research library.


