


After nearly two years of high interest rates, investors are anticipating rate cuts in the coming months. The transition from highly expansionary to highly contractionary monetary policy in recent years, coupled with current expectations for another policy shift, make it an ideal time to assess the relationship between financial conditions and monetary policy. This analysis does exactly that.
We examine the US Federal Reserve’s response to changing financial conditions, as well as the subsequent impact of these actions on financial conditions. Our findings illustrate that financial conditions are a relevant indicator for investors to monitor.
Investors will benefit from a deeper understanding of how the dynamics between financial conditions and monetary policy evolve as policy shifts occur. Understanding this relationship will help investors prepare for policy shifts both now and in the future.
This analysis focuses on the Fed’s recent rounds of quantitative easing (QE) and quantitative tightening (QT).
We examined weekly data for the Federal Reserve Bank of Chicago’s National Financial Conditions Index (NFCI) from 31 January 2014 through 31 January 20241. The NFCI measures the state of financial conditions, consisting of 105 indicators of risk, credit, and leverage2. We also obtained weekly data for the risk, credit, and leverage subindexes from the NFCI over the same period3. Similarly, we gathered weekly data on the Fed’s balance sheet from 31 January 2014 through 31 January 20244.
Fed assets have grown tremendously over the period, nearly doubling to $7.6 trillion as of 31 January 2024 from $4.1 trillion as of 31 January 2014. Most of this growth occurred in the first half of 2020, however, due to the Fed’s QE. The left-hand panel of Exhibit 1 visualizes the trends in the NFCI index, as well as in the risk, credit, and leverage subindexes, over the period. The right-hand panel of Exhibit 1 shows the trends in the NFCI index along with the increase in Fed assets over the period. Notably, financial conditions have generally been looser than their historical average as indicated by negative NCFI values over the period, except for March and April 2020.
Exhibit 1
Sources: Federal Reserve Economic Data (FRED), Federal Reserve Bank of Chicago
Lead/Lag Analysis for the QE Sample
For this analysis, we examine the lead/lag relationship between the Fed’s balance sheet and the NFCI, following the lead/lag analysis conducted by Putnins (2022) between the Fed’s balance sheet and stock market returns. We first conduct this analysis over a period of QE, and later repeat the same analysis over a period of QT. On 15 March 2020, the Fed announced its plans to implement a round of QE in response to the onset of the coronavirus pandemic.
This large-scale purchasing of assets continued until the beginning of May 2022, when the Fed announced that it would begin a round of QT. Thus, for the QE sample, the period begins on 11 March 2020 (the Wednesday prior to the QE announcement, since NFCI data is available on Wednesday each week) and ends on 27 April 2022, just prior to the Fed’s QT announcement in early May.
We begin by calculating the weekly log change in Fed’s assets5. And then we examine the relationship between the weekly log change in Fed assets in week n and the weekly value of the NFCI in week n + k, where n represents the point in time with no leads/lags and k represents the amount of the lead/lag in weeks, ranging from a lag of -10 weeks to a lead of +10 weeks.
In other words, week n does not refer to a particular week, but rather, refers to the “base week,” or the point in time for any given week with no leads/lags (k = 0). Negative values for k (i.e., past values of the NFCI) capture how the Fed responded to either improving or deteriorating past financial conditions, while positive values for k (i.e., future values of the NFCI) capture how the Fed’s actions subsequently affected financial conditions.
We analyze the relationship between the weekly log change in Fed assets and the weekly value of the NFCI by running a time-series regression6 of NFCIn+k on ∆FedAssetsn for each lead/lag value of k. Put differently, we keep the time-series of the weekly log change in Fed assets fixed at week n (the “base week”) and shift the time series of the NFCI back k=-1,-2,…,-10 weeks and forward k=1,2,…,10 weeks relative to week n. The model is given by the following regression equation:
NFCIn+k= β0+β1 ∆FedAssetsn+εn+k
Similarly, we run time-series regressions of Subindexn+k on ∆FedAssetsn for the risk, credit, and leverage subindexes for each lead/lag value of k, as shown by the following regression equation:
Subindexn+k= β0+β1 ∆FedAssetsn+εn+k
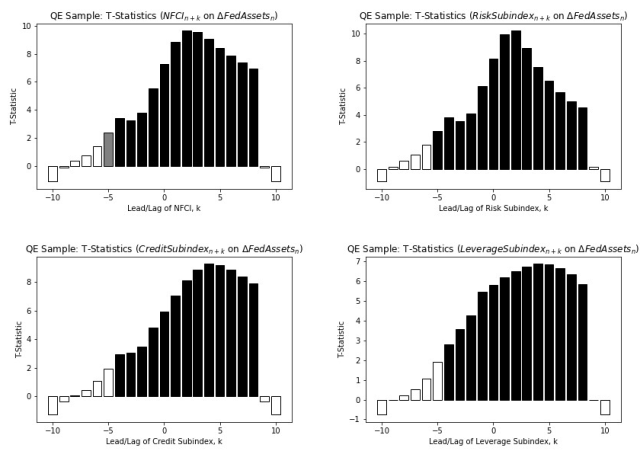
Exhibit 2 shows the t-statistics from the regressions of NFCIn+k on ∆FedAssetsn in the top left panel for each lead/lag value of k. The t-statistics from the regressions of Subindexn+k on ∆FedAssetsn for the risk, credit, and leverage subindexes are displayed in the top right, bottom left, and bottom right panels, respectively, for each lead/lag value of k. Shaded columns indicate statistically significant t-statistics, with grey columns representing significance at the 5% level and black columns representing significance at the 1% level.
Exhibit 2
Source: CFA Institute Calculations
Based on these results, the relationship between the weekly log change in Fed assets and the weekly value of the NFCI is significant from k=-5 through k=8, as indicated by the significant t-statistics in the top left panel of Exhibit 2. The positive and significant t-statistics prior to k=0 suggest that the Fed expanded its balance sheet through implementing a round of QE in response to an increase in the NFCI up to five weeks prior. This result is intuitive given that increasing values for the NFCI indicate tightening financial conditions, which in turn prompts the Fed to implement accommodative monetary policy (in this case, through QE) to stimulate the economy.
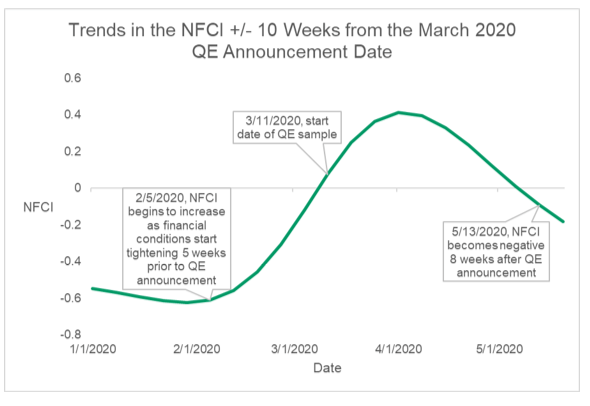
Subsequently, the NFCI remained positive for an additional eight weeks following the Fed’s QE announcement, shown by the positive and significant t-statistics following k=0 through k=8. This means that it took eight weeks for financial conditions to loosen after the Fed’s QE announcement, which is consistent with the underlying data that shows the value of the NFCI becoming negative on 13 May 2020.
This illustrates that the effects of monetary policy actions take time to transmit through the economy. Indeed, the full effects of monetary policy on the economy may take more than a year to become evident, although this lag can vary in length. Nonetheless, the effects of monetary policy actions on the economy and on financial conditions are not instantaneous. Exhibit 3 visualizes these trends.
Exhibit 3
Source: Federal Reserve Bank of Chicago
The results for the risk, credit, and leverage subindexes in the top right, bottom left, and bottom right panels of Exhibit 2, respectively, are nearly identical to those for the overall NFCI. Specifically, the Fed expanded its balance sheet in response to an increase in each subindex. This means that monetary policy became increasingly expansionary as volatility increased and as credit and leverage conditions deteriorated. Subsequently, it took eight weeks for risk, credit, and leverage conditions to loosen following the Fed’s QE announcement.
Lead/Lag Analysis for the QT Sample
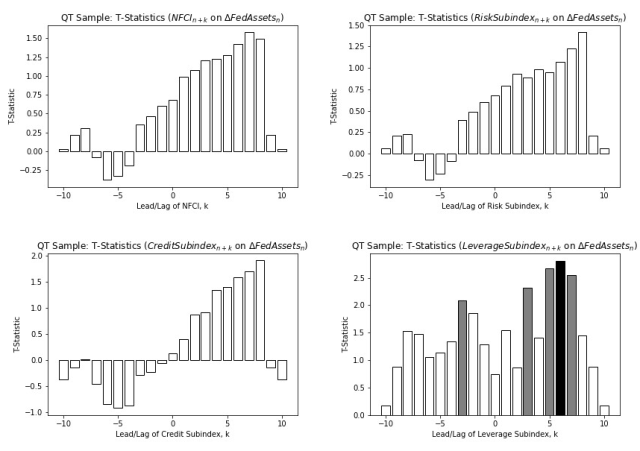
After slightly more than two years of large-scale asset purchases, the Fed announced on Wednesday 4 May 2022 that it would begin a round of QT. Thus, we repeat the analysis we conducted for the QE sample over a period of QT, beginning on the Fed’s QT announcement date (4 May 2022) and ending on 1 March 2023. We chose this as the end date given that the Fed increased its balance sheet again for a short period following this date. Exhibit 4 displays the t-statistics from the regressions of NFCIn+k on ∆FedAssetsn and Subindexn+k on ∆FedAssetsn, with grey and black columns representing significance at the 5% and 1% levels, respectively.
Exhibit 4
Source: CFA Institute Calculations
Unlike for the QE sample, the relationship between the weekly log change in Fed assets and the weekly value of the NFCI is insignificant for the QT sample. The shapes of the graphs for the overall NFCI, risk subindex, and credit subindex in the top left, top right, and bottom left panels of Exhibit 4, respectively, resemble the shapes for these graphs in Exhibit 2, although none of the t-statistics are significant.
The leverage subindex, however, has a positive and significant t-statistic at k=-3, indicating that the Fed may have responded to declining values for the leverage subindex (loose leverage conditions) by contracting its balance sheet. In general, however, the relationship between the Fed’s balance sheet and the NFCI appears to be insignificant over this period. A potential reason for the significant relationship between the Fed’s balance sheet and the NFCI over the QE sample is that the size and scope of the QE was unprecedented.
The Fed’s balance sheet expanded to $7 trillion in July 2020 from $4.2 trillion in March 2020, nearly doubling in such a short span. Also, the Fed even purchased corporate bond ETFs directly beginning in May 2020 in addition to government securities. The size and scope of the QE had a major impact on financial conditions, leading to a strong relationship between the Fed’s balance sheet and the NFCI, as illustrated by the significant t-statistics in Exhibit 2.
In contrast, the Fed’s approach to QT has been gradual, with the Fed’s balance sheet declining slowly relative to its expansion during the QE period. In fact, the Fed began its round of QT by simply allowing bonds to mature without reinvesting proceeds, rather than selling securities.
The Fed’s more modest approach to QT relative to QE likely resulted in a weaker relationship between the Fed’s balance sheet and the NFCI over the QT sample than over the QE sample. It might be a different story, however, if the size and scope of the Fed’s QT matched that of its QE.
Key Takeaways
These results are relevant to the current state of markets given the uncertainty surrounding the timing of rate cuts. There are a few key points to take away. First, the relationship between monetary policy and financial conditions is more prominent when monetary policy is aggressive, which was the case for the QE sample. Specifically, the Fed responded to tightening financial conditions (consisting of increasing volatility and deteriorating credit and leverage conditions) by expanding its balance sheet through QE beginning in March 2020.
Second, financial conditions remained tight for eight weeks following the Fed’s QE announcement, after which the value of the NFCI became negative as financial conditions began to loosen in response to the QE. The lag in this response illustrates that the effects of monetary policy actions take time to transmit through the economy.
Third, the Fed’s implementation of QT was more modest than its implementation of QE. As a result, the size and scope of the Fed’s QT was substantially smaller than that of its QE, leading to a weaker relationship between monetary policy and financial conditions over the QT sample.
Footnotes