
By ATGL
Updated July 4, 2025
One of the biggest challenges for investors is accurately timing market entries and exits. Traditional indicators often lag price action or provide conflicting signals, leaving you uncertain about when market trends will continue or reverse.
The Elliott Wave pattern solves this problem by identifying predictable cycles in market behavior. This framework recognizes that human emotions drive price movements in measurable patterns, creating recognizable wave structures during both bull market advances and bear market declines.
This article will examine the core principles of Elliott Wave theory, demonstrate its practical trading applications, and show how to integrate this methodology with complementary technical indicators for enhanced market analysis.
Elliott Wave Chart Pattern Structure and Market Psychology
The Elliott Wave pattern works on a simple idea: market prices move in predictable cycles driven by investor psychology. Ralph Nelson Elliott discovered that financial markets follow natural patterns that repeat across different timeframes, from minute-by-minute charts to multi-year cycles. The Elliot Wave is now one of the most popular trading patterns for identifying directional trends and market turning points.
Unlike many other trading patterns, Elliott Wave incorporates both price action and market psychology. Market psychology is evident in crowd behavior. Individual trading decisions combine to create recognizable wave patterns that reflect market sentiment. During bull market phases, waves show periods of growing confidence followed by moments of doubt or profit-taking. In bear market conditions, the pattern reverses with downward waves driven by fear and selling pressure. The pattern tracks how traders react to market data and price action, creating predictable structures.
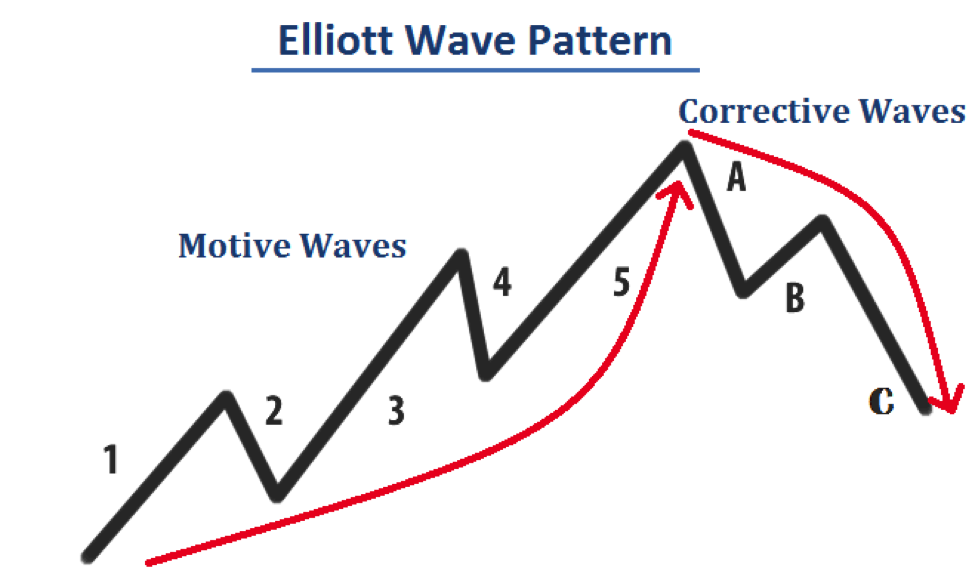
The Elliott Wave pattern represents one complete market cycle with eight waves. Five waves drive the main trend, while three waves create temporary moves against that trend. This structure appears in all active markets and across all timeframes.
Breaking Down the Basic Elliott Wave Pattern
The complete Elliott Wave cycle has eight waves that form a predictable sequence. The first five waves, numbered 1 through 5, make up the main trend phase. The final three waves, labeled A, B, and C, create the correction phase that moves against the main trend.
Main trend waves push prices in the direction of the larger trend, while correction waves represent temporary pauses or pullbacks. In bull market environments, main trend waves push prices higher while correction waves create temporary drops. In bear market conditions, main trend waves drive prices lower while correction waves create temporary rallies.
How Impulse Waves Drive the Trend
Wave 1 typically starts after a major correction, often beginning with doubt from market participants. Wave 2 then retraces a significant portion of Wave 1’s advance — commonly between 50% and 78.6% — based on key Fibonacci retracement levels.
Wave 3 represents the strongest phase, driven by widespread recognition of the new trend. This wave typically moves beyond Wave 1 by at least 161.8%, indicating accelerating momentum and increased participation. Wave 3 gets the most attention and creates the highest volume.
Wave 4 creates sideways movement, typically pulling back 23.6% to 38.2% of Wave 3, often establishing new support and resistance levels. Wave 5 completes the sequence but often shows weaker momentum compared to Wave 3, frequently showing divergence with momentum indicators.
Corrective Waves and What They Signal
The three-wave correction sequence (A-B-C) represents a natural pause in the main trend, often respecting key support and resistance levels from previous market action. Wave A starts the correction, often catching participants off guard. Wave B creates a move against the correction, typically pulling back 50% to 78.6% of Wave A. Wave C completes the correction and often equals or exceeds Wave A’s length.
How To Identify Elliott Wave Patterns in Real Time
Finding Elliott Wave patterns requires systematic observation of price action and wave characteristics. Look for clear five-wave sequences that show increasing momentum, followed by three-wave corrections that move against the trend. These price patterns emerge when investor sentiment shifts between optimism and pessimism.
Proper wave labeling requires attention to specific rules. Wave 2 cannot pull back more than 100% of Wave 1, and Wave 4 cannot overlap with Wave 1’s price area. Wave 3 must not be the shortest wave and often represents the longest wave.
Common mistakes include forcing wave counts onto price action that doesn’t meet the rules and changing counts too quickly. Focus on what the market has already shown rather than trying to predict future moves and use multiple timeframes to confirm wave counts.
Using Fibonacci Ratios To Strengthen Wave Forecasts
Fibonacci ratios offer mathematical relationships that align with Elliott Wave patterns, providing specific targets for projections and pullback levels. Wave 2 corrections typically pull back between 50% and 78.6% of Wave 1, while Wave 4 corrections usually stay within 23.6% to 38.2%.
Wave 3 typically extends 161.8% to 261.8% beyond Wave 1’s length, while Wave 5 often equals Wave 1 or extends to 61.8% or 161.8% of the distance from Wave 1’s start to Wave 3’s end. Wave C frequently equals Wave A or extends to 161.8% of Wave A’s distance.
How To Trade With Elliott Wave Patterns
Trading Elliott Wave patterns requires understanding the best entry and exit points within wave structure. The best opportunities arise after correction waves have completed, positioning traders for the next main trend sequence. Wave 2 and Wave 4 corrections offer high-probability entries with clear risk levels.
Entry strategies should focus on wave completion signals rather than trying to catch corrections as they occur. Wave 3 provides the most profitable opportunities due to its strong nature. Enter after Wave 2 completes and ride momentum through Wave 3’s development.
Stop-loss placement should align with wave invalidation points. For positions entered after Wave 2, place stops below Wave 1’s starting point. For Wave 4 entries, place stops below Wave 1’s peak.
Wave counting remains subjective and open to interpretation. The accuracy of Elliott Wave Theory depends on its proper application, as it provides a framework for understanding market structure rather than making exact predictions.
Risk Management Strategies With Wave-Based Setups
Position sizing should reflect different waves’ probability and risk-reward characteristics. Wave 3 trades offer the best risk-reward ratios and support larger positions. Wave 5 trades require smaller sizing due to potential pattern completion risks.
Regular wave count review identifies when the original analysis no longer applies. Stay objective and adapt to changing conditions rather than forcing failing counts.
Combining Elliott Wave With Technical Indicators
Technical indicators provide valuable confirmation for Elliott Wave analysis and help gauge investor sentiment. Momentum indicators, such as MACD and RSI, often align with wave characteristics, providing additional evidence for wave identification.
Wave 3 typically creates the strongest momentum readings, with MACD showing significant upward momentum and RSI reaching overbought levels. Volume expansion during Wave 3 confirms real trend patterns.
Wave 5 frequently shows momentum divergence, with indicators failing to reach new highs despite advancing prices. This divergence signals potential pattern completion and warns of reversals.
Volume analysis adds confirmation. Main trend waves show expanding volume, while correction waves show contracting volume. Wave 3 usually creates the highest volume, confirming its role as the strongest wave.
Put the Elliott Wave Chart Pattern To Work in Your Strategy
The Elliott Wave pattern offers a systematic framework for understanding market cycles and predicting trend developments. By combining wave structure analysis with Fibonacci ratios and complementary indicators, traders can develop investment strategies that work with natural market rhythms.
Above the Green Line provides advanced tools and resources for implementing Elliott Wave analysis in your technical stock analysis. Our comprehensive approach combines Elliott Wave principles with modern analytical techniques, helping you identify high-probability opportunities while managing risk effectively. Elevate your strategy with advanced market analysis tools built for disciplined traders and serious investors.
Related Articles

 Outpaces Stock Market Gains: What You Should Know")


