

Key takeaways:
-
Bitcoin rallied above $109,000 as the global money supply reached new highs.
-
BTC open interest rose by 10% amid a strong Coinbase Premium and stable funding rate, pointing to spot demand.
-
Multiple technical indicators suggest a major breakout is underway, with analysts eyeing a $137,000 Bitcoin price.
Bitcoin (BTC) price jumped on Wednesday, rising by 3.6% and reaching $109,730 for the first time since June 12. The recovery occurred at the back of the global money supply (M2), reaching a new all-time high above $55 trillion.
If Bitcoin closes the daily candle above $108,500, it will confirm a strong bullish engulfing pattern, increasing the likelihood of new highs sooner rather than later.
Bitcoin open interest jumps over 10% during rally
Bitcoin’s recent price jump to $109,500 from $105,200 was outlined by a sharp rise in derivatives activity, pointing to renewed momentum. Open interest (OI) across major futures exchanges surged by 10%, or approximately $3.2 billion, signaling a substantial influx of capital into the market. The increase was primarily driven by long positions, suggesting confidence in further upside.
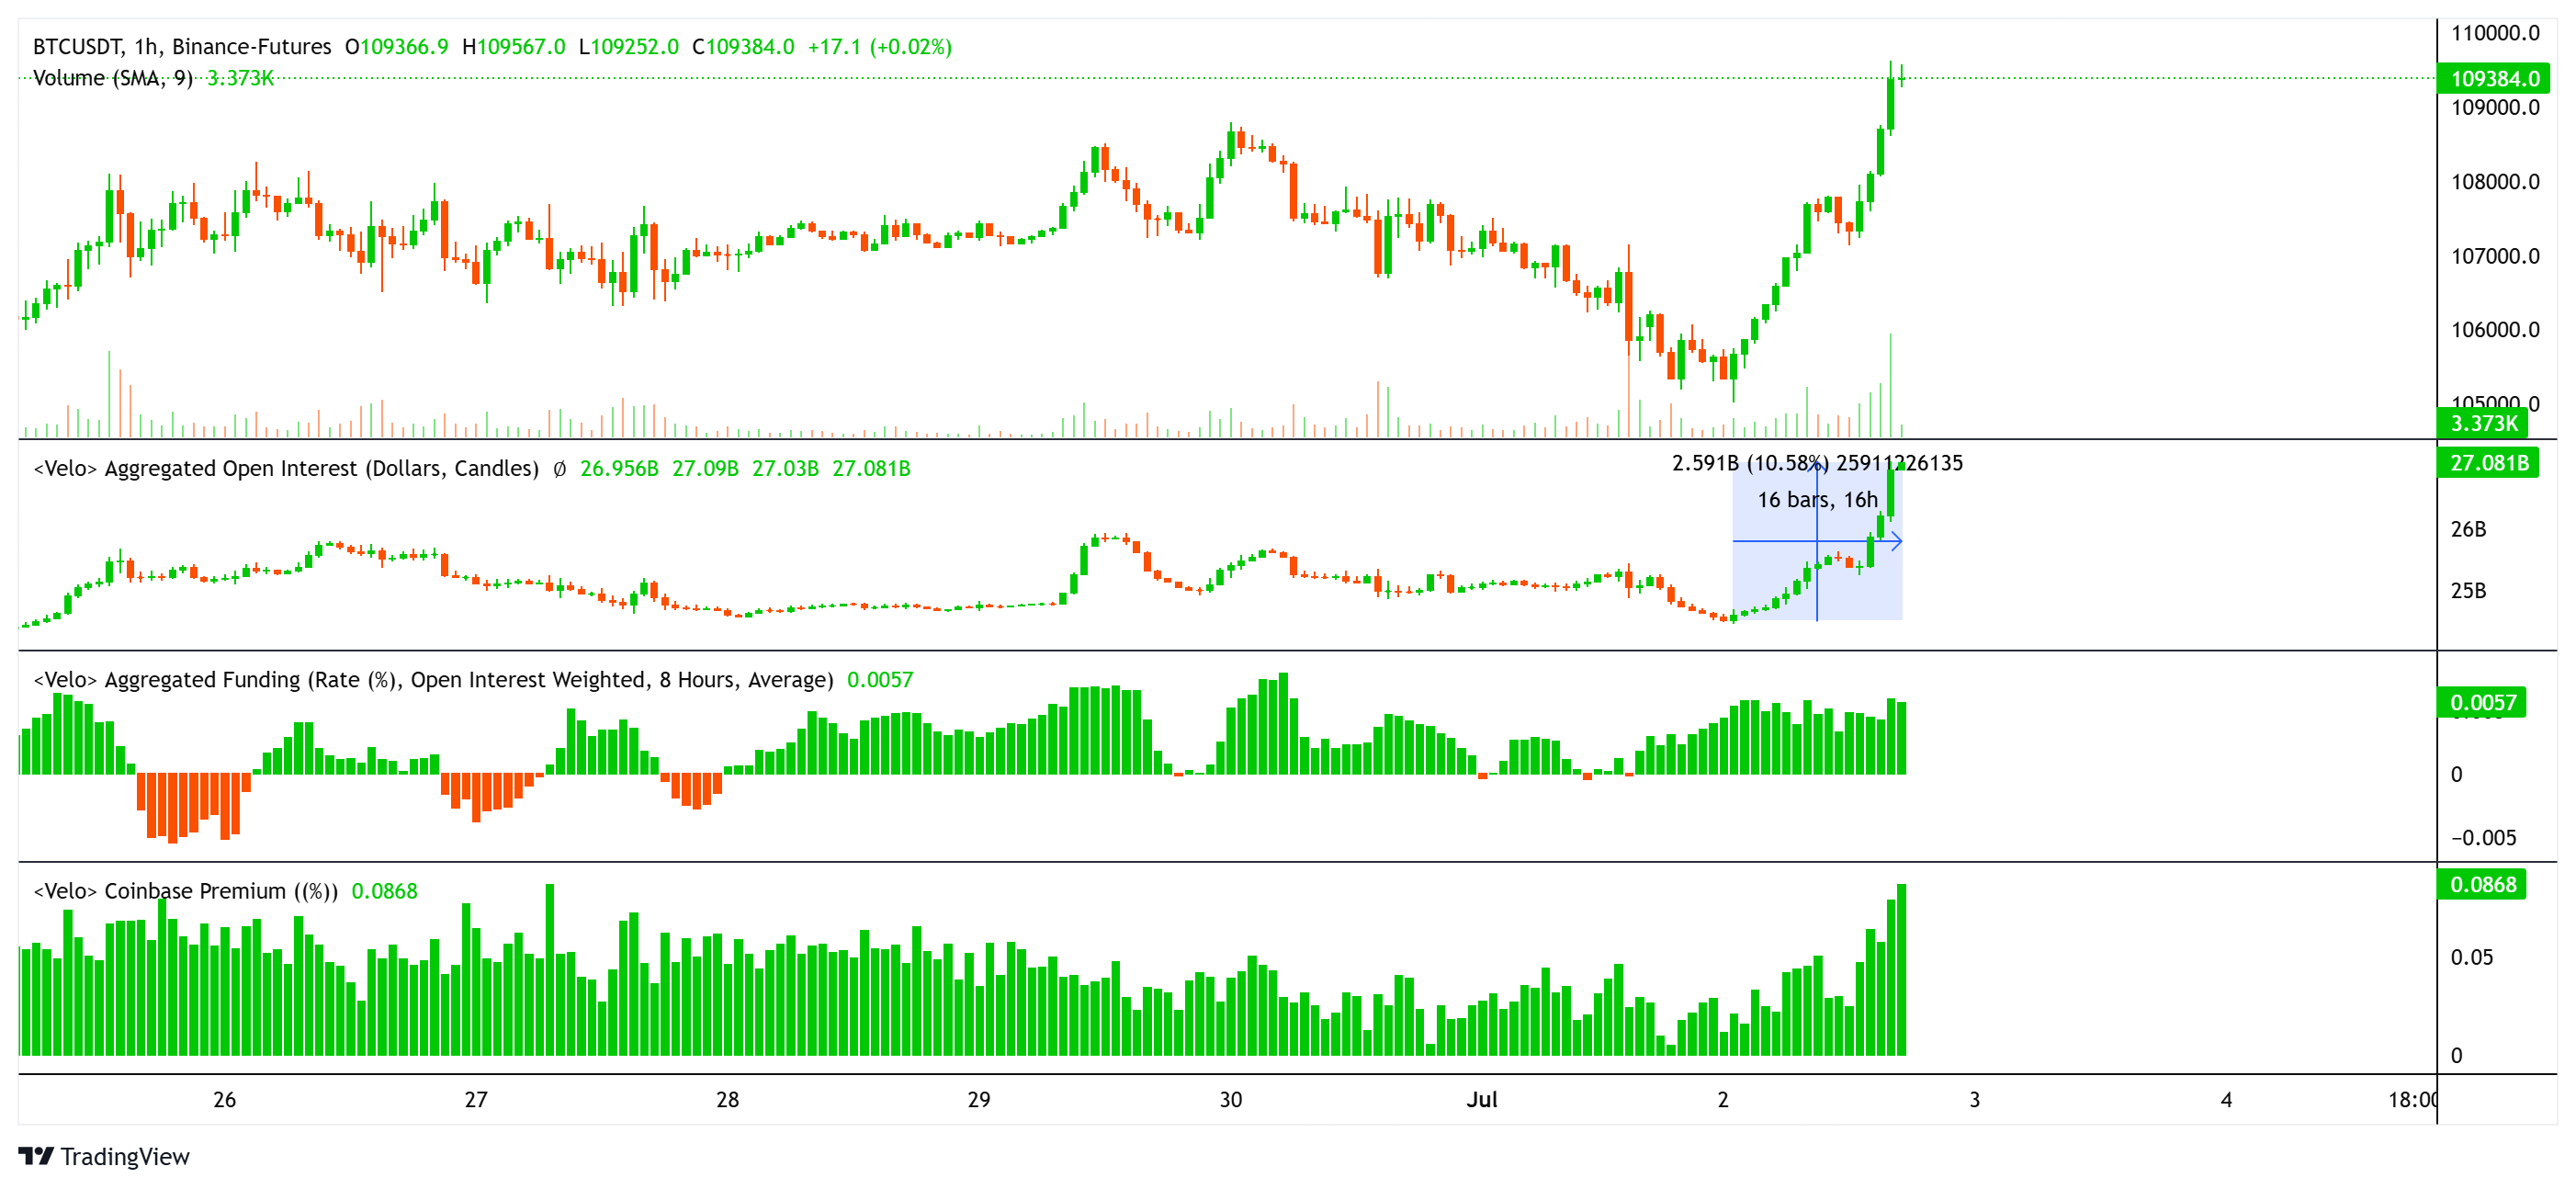
Despite the uptick in price and OI, funding rates remained stable across perpetual futures markets. This indicates a balanced sentiment between long and short traders, and more importantly, that the rally was not driven by excessive leverage. From a bullish standpoint, stable funding during a price increase implies that the uptrend may be more sustainable.
A notable short squeeze accompanied the move, with over $196 million in short positions liquidated within the past 12 hours. This liquidation cascade likely accelerated Bitcoin’s push past key resistance levels.
Further validating the buy-side strength, the Bitcoin Coinbase Premium Index stayed elevated throughout the move. This metric, which tracks the price difference between Coinbase and other major exchanges, suggests consistent spot buying pressure from US-based institutional and retail investors, adding weight to the bullish case.
Related: Bitcoin price target ‘sits around $170K’ as global M2 supply reaches record high
Is a BTC all-time high pending?
With Bitcoin decisively breaking out of its recent sideways range, market analysts are increasingly confident that a new all-time high is imminent. According to trader Rekt Capital, a record weekly close above $109,300 this Sunday could place BTC above its final major resistance zone, effectively “unlocking” price discovery and paving the way for new highs.
Adding to the bullish narrative, analyst Jackis highlighted that Bitcoin recently reached its lowest volatility levels since 2023, a rare occurrence seen only seven times in its history. “Every time we’ve hit these levels, a major volatility spike followed within five weeks, often sooner,” Jackis noted, suggesting a significant move is on the horizon.
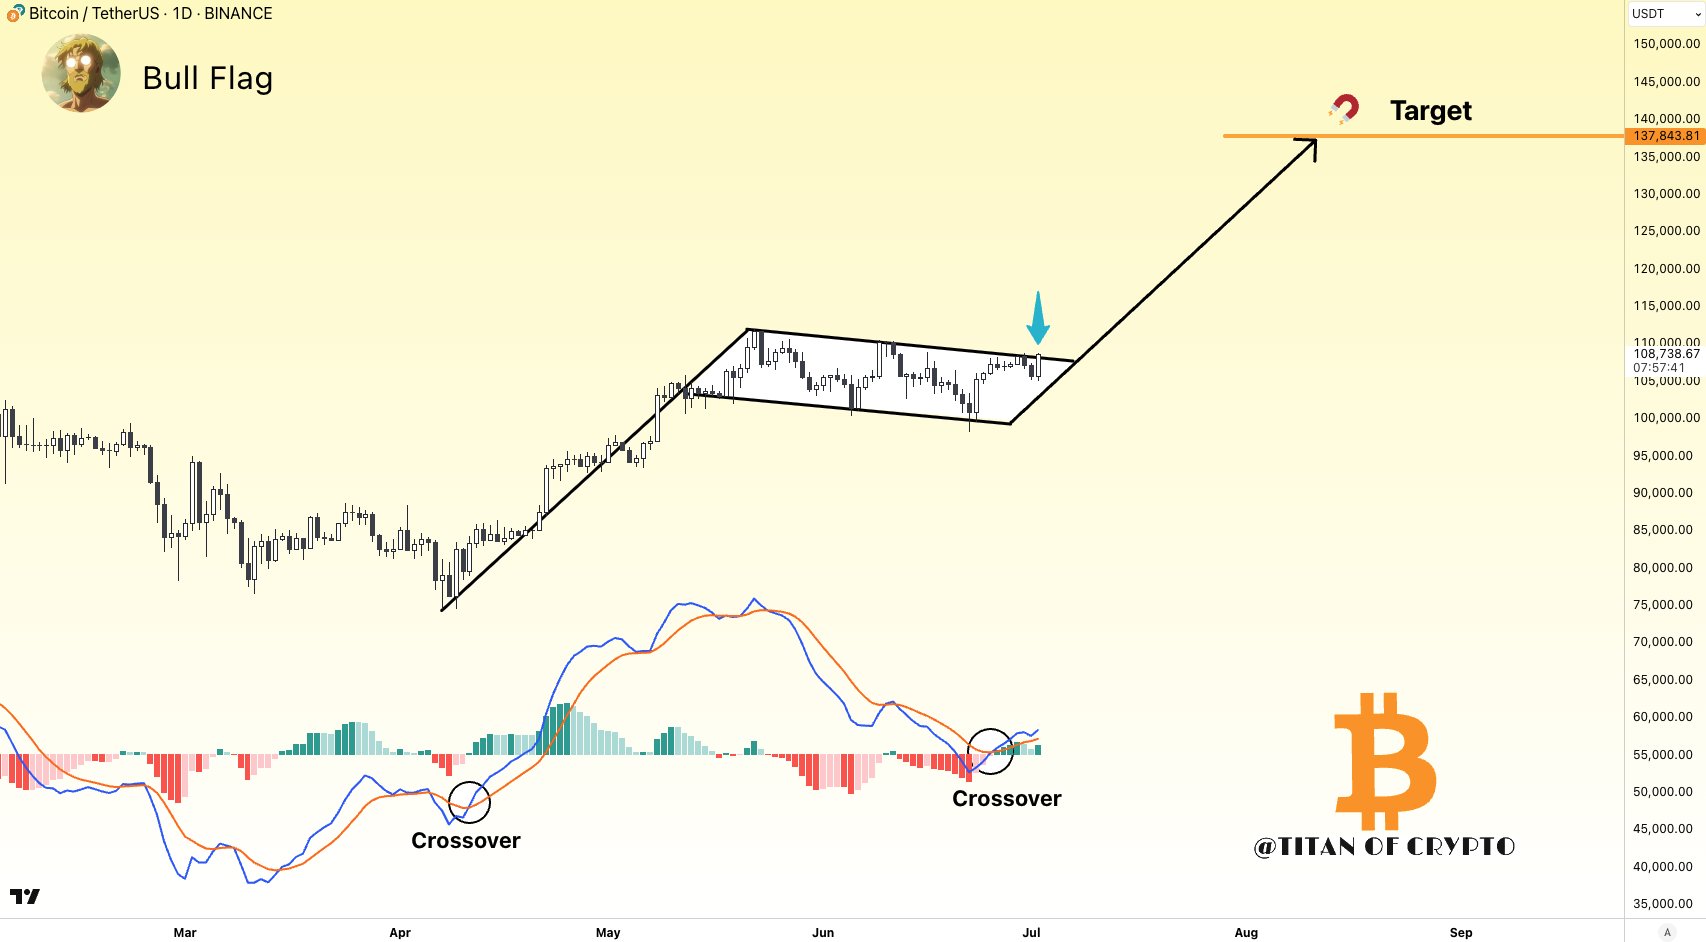
Meanwhile, technical analyst Titan of Crypto pointed to a confirmed bullish MACD crossover on the daily chart as a key momentum signal. The analyst added that BTC is attempting a breakout from a bullish flag pattern, with a successful push likely triggering a “magnet effect” toward the $137,000 region.
Related: Bitcoin squeezes shorts in $108K spike as US jobs drop most in 2 years
This article does not contain investment advice or recommendations. Every investment and trading move involves risk, and readers should conduct their own research when making a decision.


