

Key points:
-
Bitcoin price wars between bulls and bears continue as traders line up end-of-month BTC price targets.
-
These include a return to $107,000 or lower before a rebound.
-
Volatility is expected as Bollinger Band readings reach historically “tight” levels.
Bitcoin (BTC) stayed rangebound at Wednesday’s Wall Street open as traders eyed a giant $17.5 billion options expiry.
BTC price targets include $107,000 and under
Data from Cointelegraph Markets Pro and TradingView showed BTC/USD teasing new local lows.
The pair reached $111,115 on Bitstamp earlier on the day before returning to $113,000, with neither bulls nor bears able to spark a clear trend.
Reviewing the landscape, market participants still saw a fresh BTC price dip before a true recovery took place.
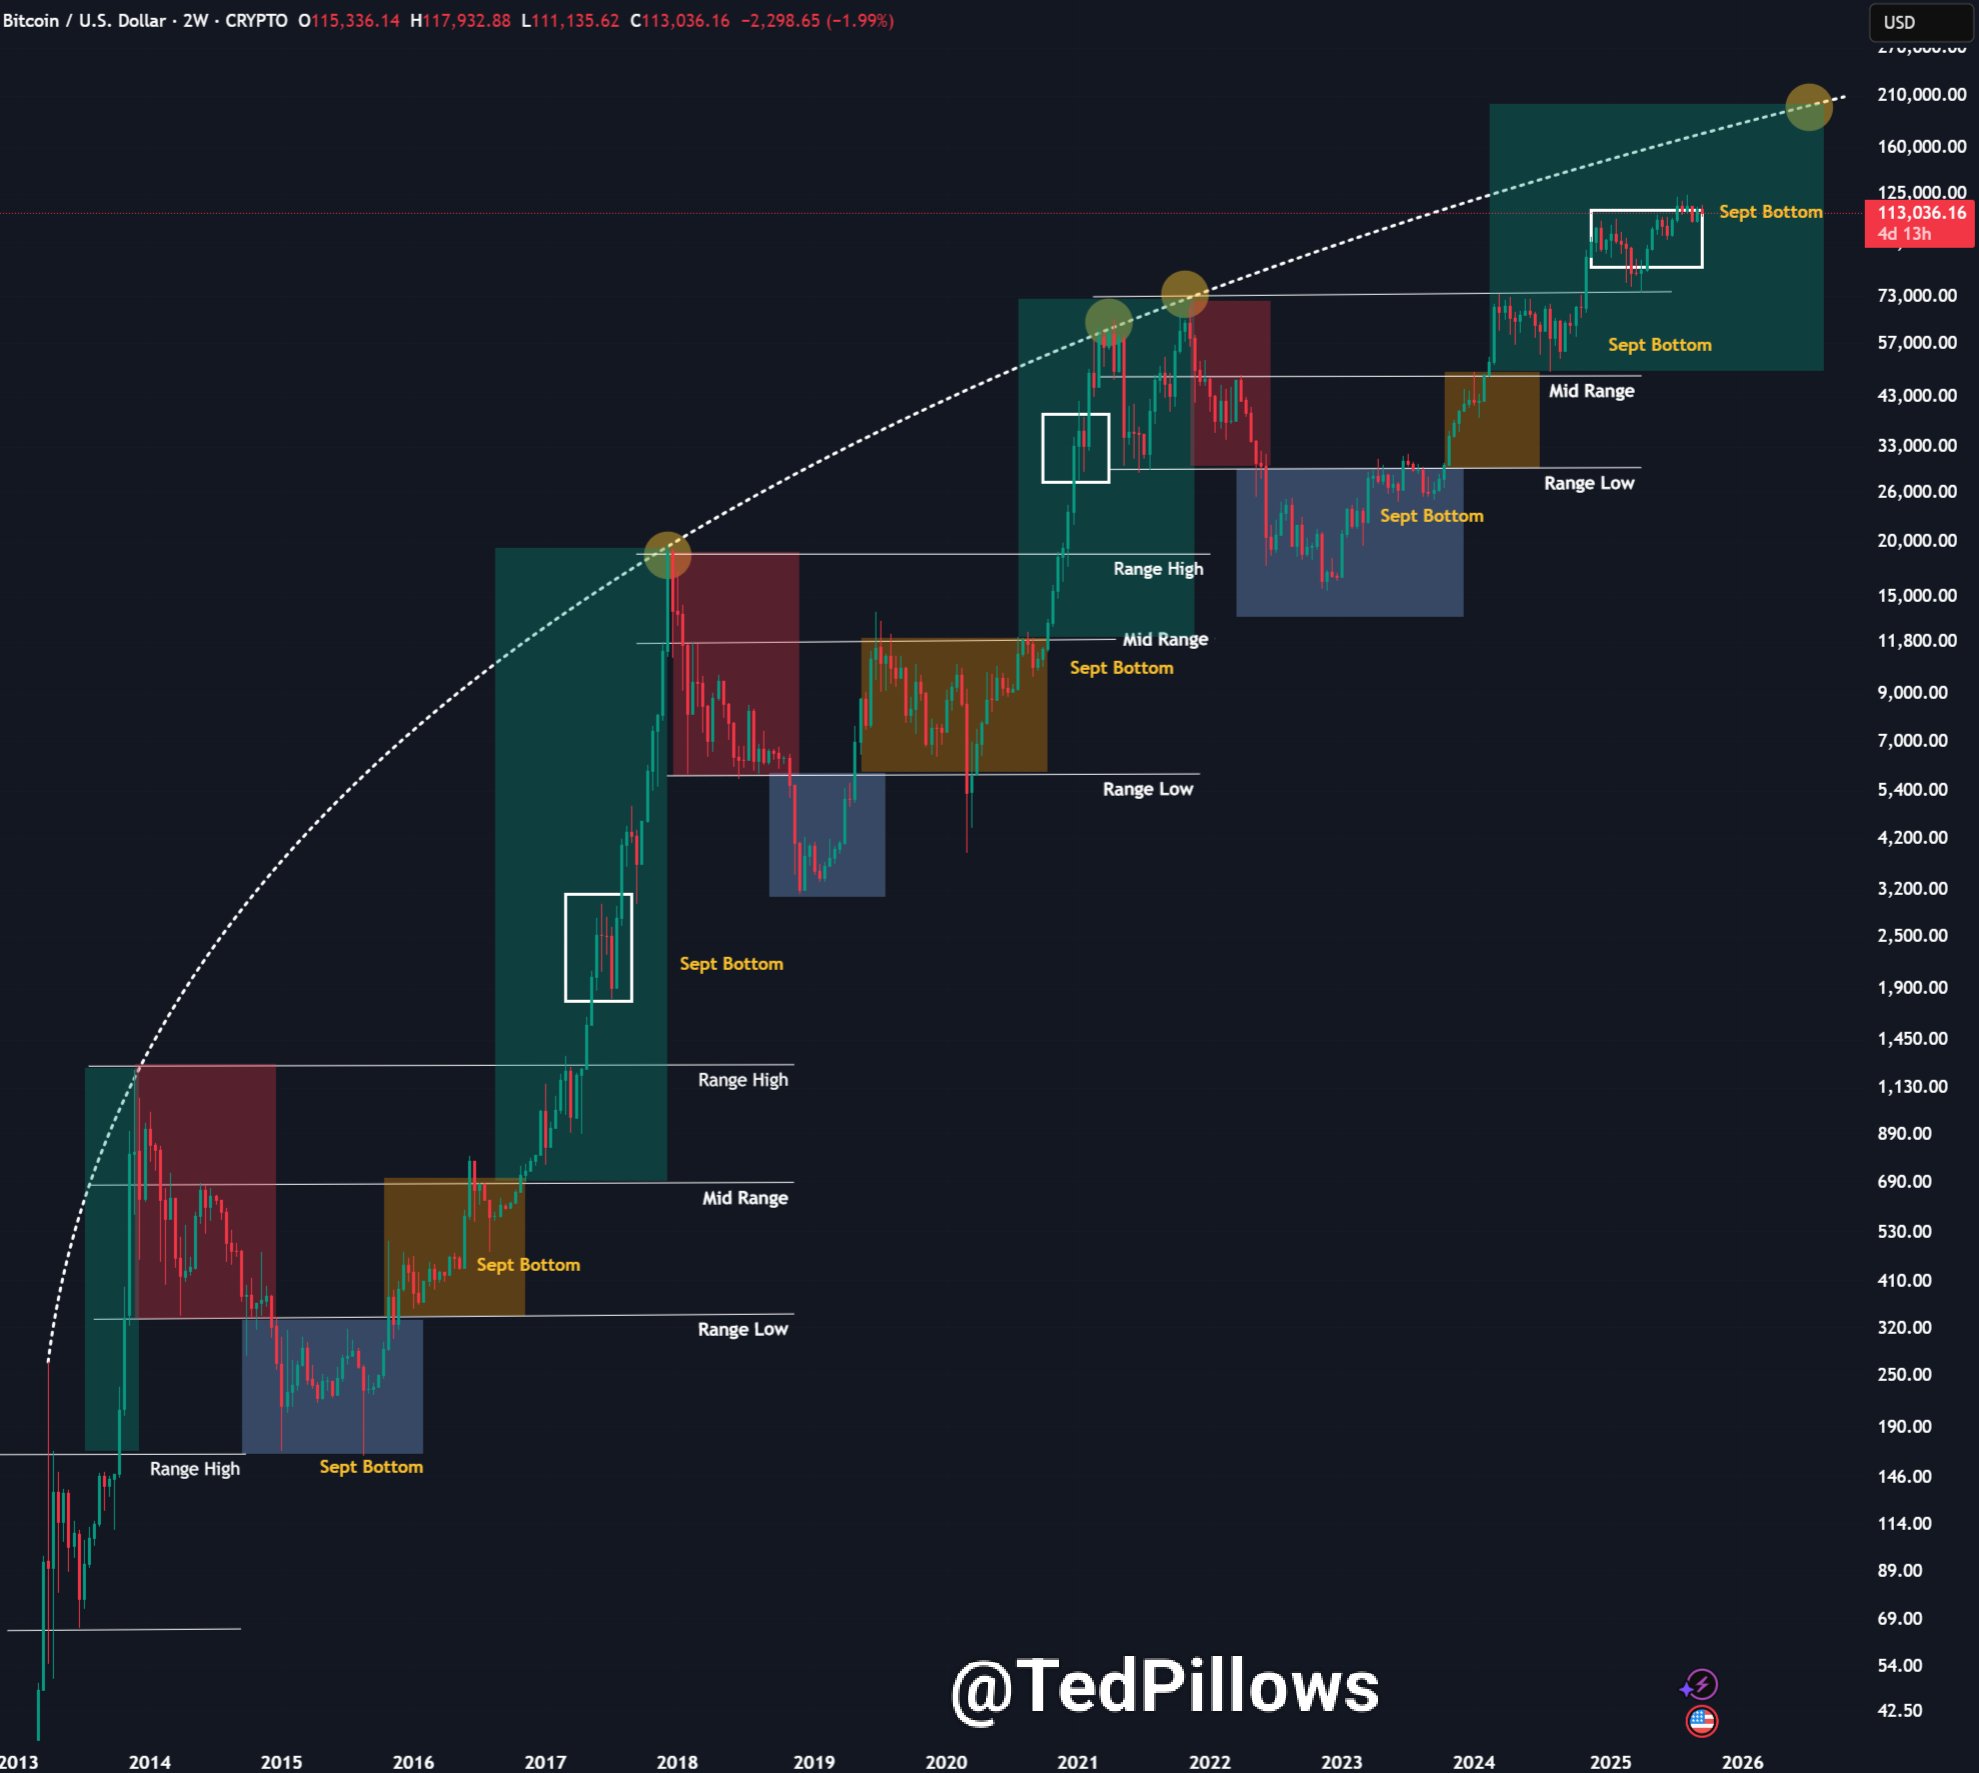
“$BTC usually bottoms in September,” crypto investor and entrepreneur Ted Pillows observed in his latest analysis on X.
“In just 2 days, $17,500,000,000 in Bitcoin options will expire with a max pain at $107,000. Historically, BTC moves towards max pain during such huge expirations. I think there's still a big leg down left before reversal.”
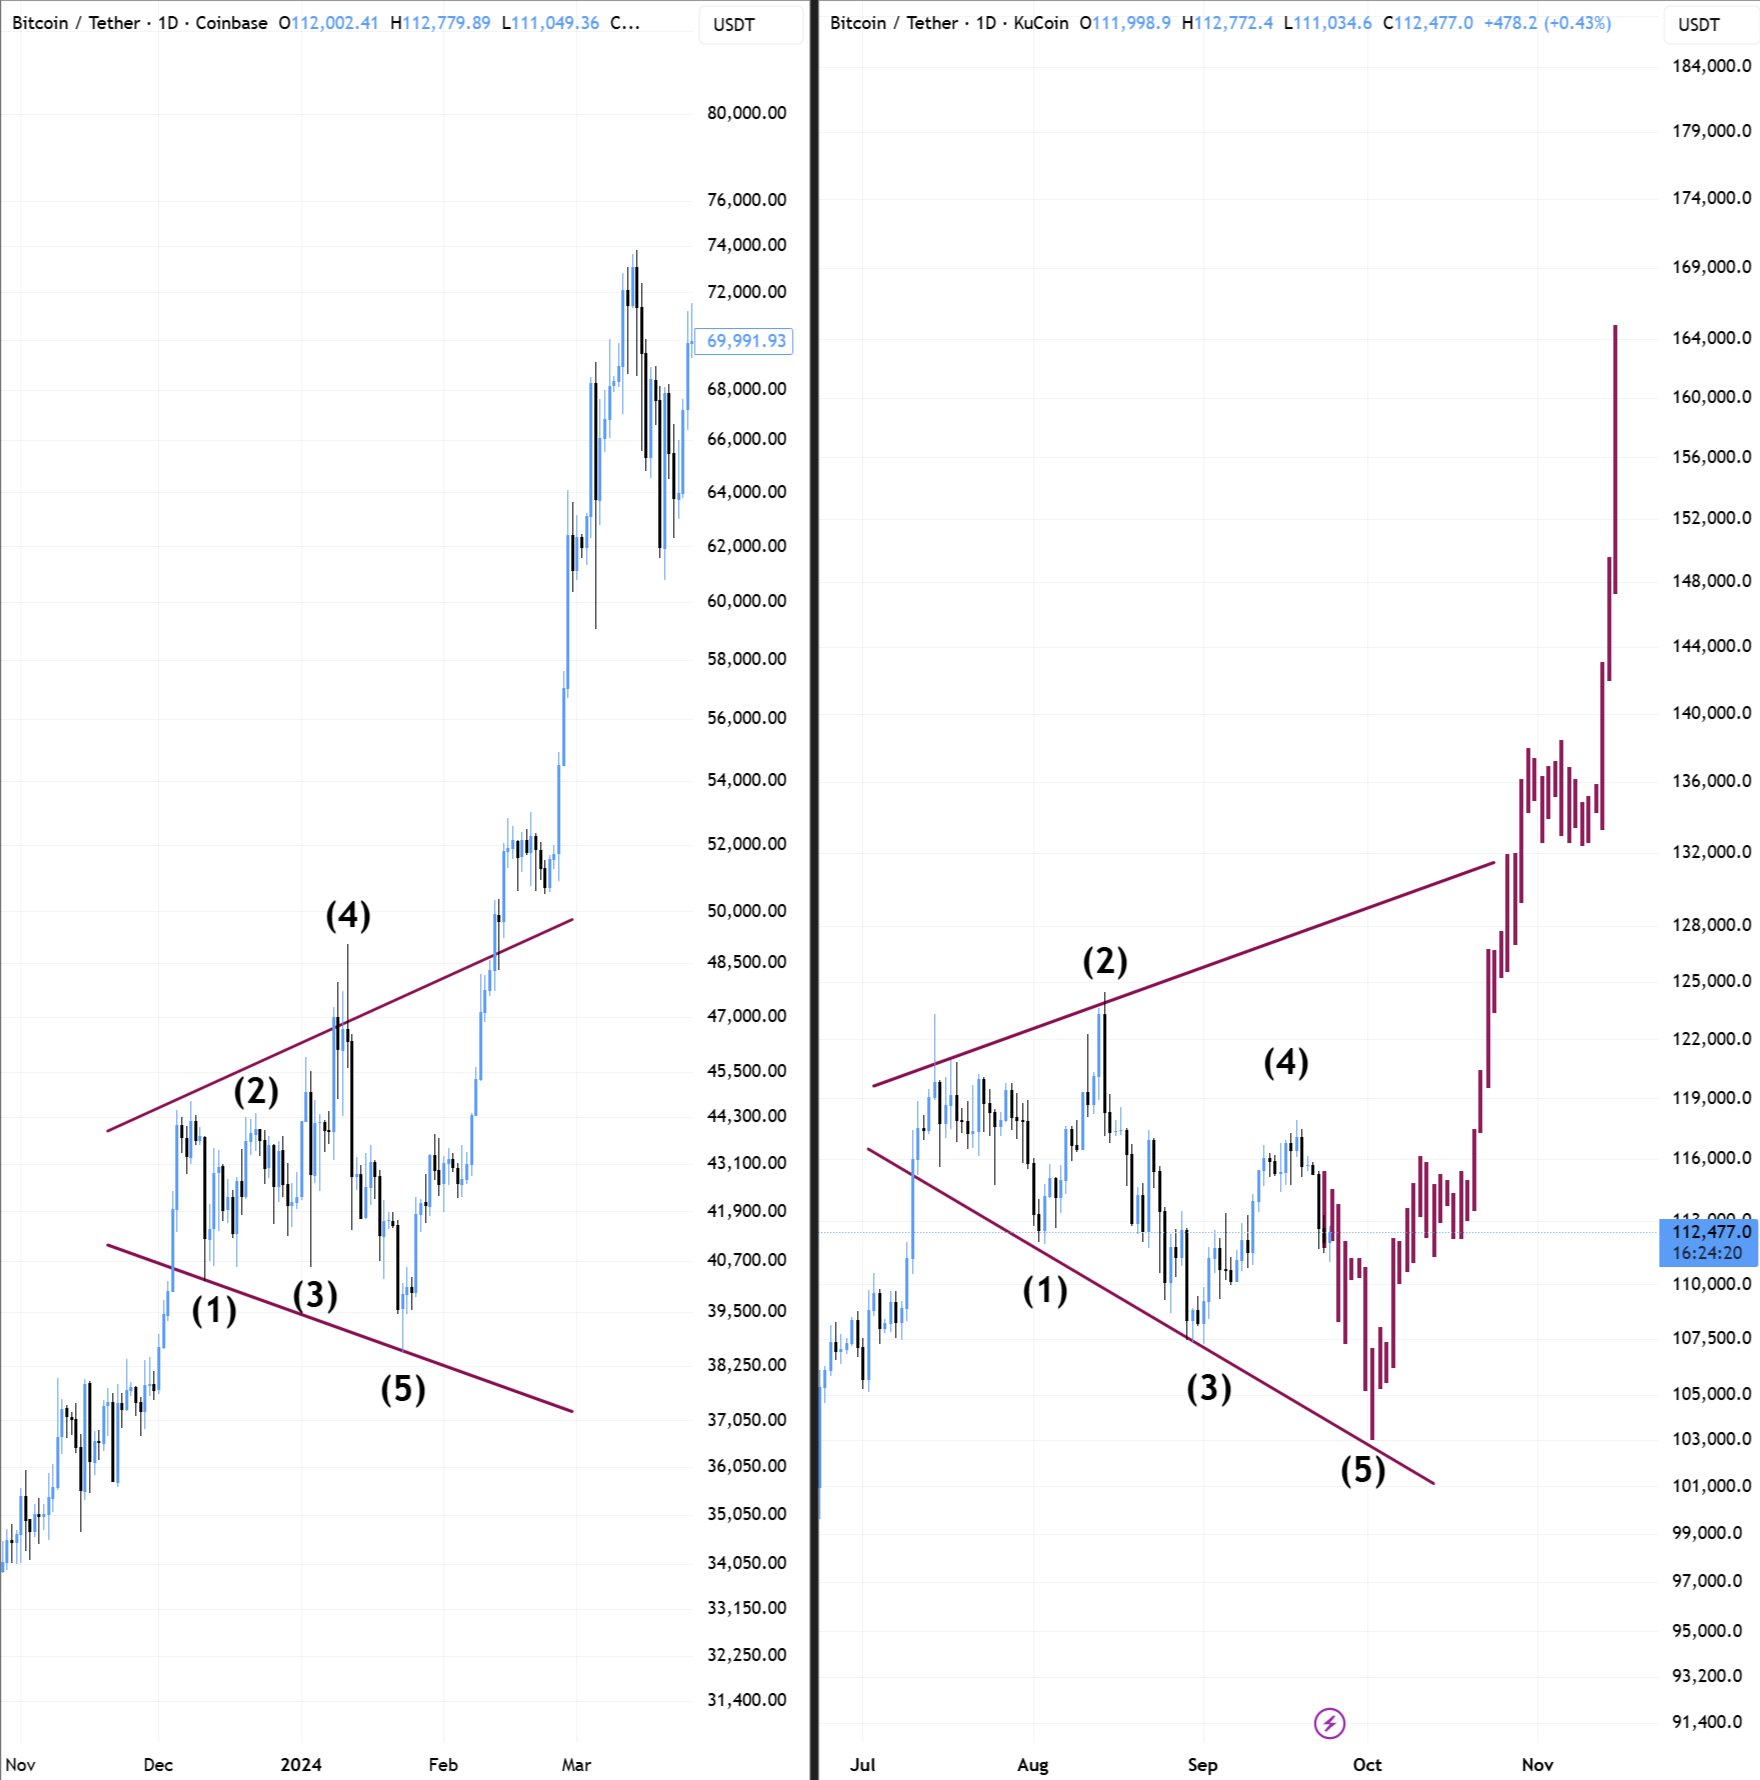
Trader BitBull offered another historical comparison, this time to earlier in the current bull market.
“$BTC is doing exactly what it did in Q1 2024,” he argued.
“The long-term trend is still to the upside, but we may get some corrections. I wouldn't be surprised if Bitcoin retests $103K-$105K level before reversal.”
The day prior, BitBull had suggested that whales may attempt to drive price below its 100-day exponential moving average (EMA) at $111,900 — something that should also create “max pain.”
Big Bitcoin price move “quite likely” within a week
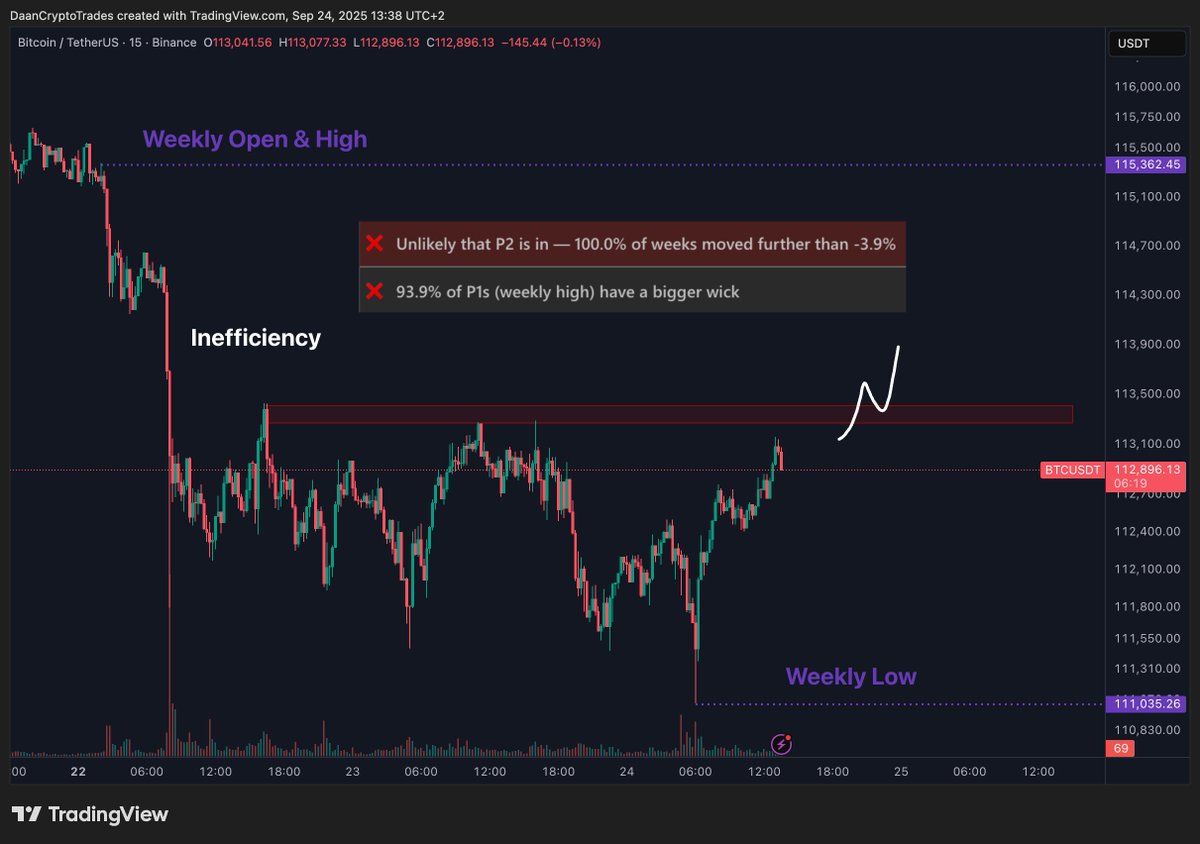
Historical context, meanwhile, led fellow trader Daan Crypto Trades to predict a much more volatile end to September, traditionally Bitcoin’s weakest month.
Related: Biggest long liquidation of the year: 5 things to know in Bitcoin this week
“$BTC Flip this local resistance and we can start talking about a reversal of this week’s dip. Pretty large inefficiency right above and a weekly candle without a proper wick above,” he wrote about the $113,000 mark in part of an X post.
“The current weekly displacement (low to high) is also the smallest it has been in the past 2 years. This means that it is extremely likely that the $111K low or $115.3K high still gets broken by the end of the week.”
The situation was the same on monthly time frames, with BTC/USD currently in line to print its narrowest monthly candle in over two years.
“Basically, price action & a larger move is quite likely until the end of the week/month based on the statistics. So keep an eye out for signs of local strength (or weakness), and bet accordingly,” Daan Crypto Trades summarized.
Bitcoin weekly Bollinger Bands are officially the tightest in the entire history of BTCUSD price action pic.twitter.com/XWNYkquVXP
— Tony “The Bull” Severino, CMT (@TonyTheBullCMT) September 23, 2025
Separate data from the Bollinger Bands indicator meanwhile showed record “narrowing” on weekly timeframes — a further precursor to fresh BTC price volatility.
This article does not contain investment advice or recommendations. Every investment and trading move involves risk, and readers should conduct their own research when making a decision.

 Dipped More Than Broader Market Today")


