
A launchpad event for Wall Street's benchmark index is the ideal scenario for optimistic long-term investors.
It's been nothing short of a wild ride for investors over the last seven months. In mid-February, the benchmark S&P 500 (^GSPC -0.01%) logged an all-time closing high, with the iconic Dow Jones Industrial Average (^DJI -0.32%) and growth-propelled Nasdaq Composite (^IXIC 0.05%) doing the same in December.
Then the wheels fell off and heightened volatility kicked in.
During the first week of April (from the closing bell on April 2 to the close of trading on April 4), the S&P 500 endured its fifth-largest two-day percentage decline in 75 years. This was followed less than a week later by the largest single-day point gains for the S&P 500, Dow Jones, and Nasdaq Composite in their respective histories.
Image source: Getty Images.
When the stock market's major indexes swing wildly, it's perfectly normal for investors to seek out prior events and metrics that correlate with significant directional moves in the S&P 500, Dow, or Nasdaq Composite. Even though no predictive indicator can guarantee what's to come, some correlative events and metrics have an uncanny track record of forecasting future stock returns.
It just so happens that a recently completed feat by the S&P 500 points to a strong probability of stocks skyrocketing over the coming 12 months.
Heightened volatility may be the near-term norm for Wall Street
But before we look to the future, we first have to examine the past and understand the variables that have laid the foundation for heightened volatility in 2025.
Arguably nothing has caused stocks to gyrate more this year than President Donald Trump's tariff and trade policies. Following the close of trading on April 2, Trump unveiled a 10% global tariff, as well as higher “reciprocal tariff rates” on dozens of countries that have historically had adverse trade imbalances with America. This unveiling is what sent the S&P 500 down 10.5% in the following two trading sessions.
A week later, the S&P 500, Dow, and Nasdaq Composite skyrocketed on a 90-day pause of these higher reciprocal tariff rates — which have again been paused and adjusted for select countries by President Trump until Aug. 1.
The concern with tariffs is twofold. First, there's the potential for tariffs to reignite the domestic inflation rate and hurt trade relations with our allies. The secondary issue is that the president and his administration have regularly changed tariff implementation dates and duty levels. Wall Street demands predictability, and investors simply aren't getting it from the current administration.
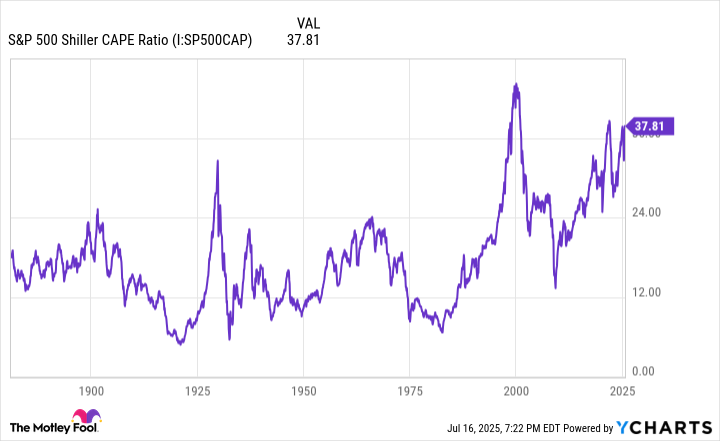
S&P 500 Shiller CAPE Ratio data by YCharts. CAPE = cyclically adjusted price-to-earnings ratio.
Investors have also been tasked with navigating one of the priciest stock market's in history.
In December, the S&P 500's Shiller price-to-earnings (P/E) ratio, also known as the cyclically adjusted P/E ratio, or CAPE Ratio, hit a multiple of 38.89, which represents the third-priciest reading during a continuous bull market when back-tested to January 1871. It's still sitting above 38 at the time of this writing on July 16.
Widening the lens a bit further, there have only been six instances in 154 years where the Shiller P/E has surpassed and held a multiple of 30 for at least two months, including the present. All five prior occurrences resulted in the S&P 500, Dow, and/or Nasdaq Composite losing at least 20% of their value.
The other prime catalyst that's caused Wall Street to wobble is Moody's downgrade of the United States' credit rating to AA1 from AAA. Moody's was the third and final major credit-rating agency to downgrade the U.S. from the highest possible rating.
While the U.S. economy continues to fire on all cylinders, this downgrade serves as a reminder that America's rapidly rising national debt is expected to, one day, become unsustainable. This is another instance of uncertainty creeping into the minds of investors.
Image source: Getty Images.
We just observed the S&P 500 do something exceptionally rare — and it bodes well for optimists
With a better understanding of why stock market volatility has been heightened in 2025 (and might continue for the foreseeable future), let's circle back to the incredibly unique feat recently completed by the S&P 500 that, historically speaking, points to significant future upside in stocks.
When Wall Street's major stock indexes take the elevator lower, it's not uncommon for investors' emotions and fear to come into play. But one of the more interesting quirks about the stock market is that the best investment opportunities often occur when things seem their most dire.
As pointed out earlier, the S&P 500 shed 10.5% between the closing bells on April 2 and April 4 and inched close to a bear market by the closing bell on April 8. As for the Nasdaq Composite, it did fall into a bear market on April 8 — its first since 2022.
But beginning on April 9, all three major indexes began to rally in a big way, and they haven't looked back. For only the sixth time since the start of 1950, the broad-based S&P 500 has gained more than 25% over a three-month period.
The S&P 500 is up 26% the past three months, one of the greatest three month returns ever.
On the surface this might sound like weakness is coming, but that isn't necessarily true. Never lower 3, 6, and 12 months later with above avg returns across the board as well. pic.twitter.com/YZM1Q76Seu
— Ryan Detrick, CMT (@RyanDetrick) July 13, 2025
As you can see in the table above from Carson Group Chief Market Strategist Ryan Detrick, Wall Street's most-encompassing index has tallied a 26% three-month gain. Although forecasting returns in the S&P 500 a month after one of these outsize return periods has been a bit of a crapshoot, there's been no mistaking how well the S&P 500 has performed one year after these phenomenal three-month gains.
Following the five previous instances where the S&P 500 rallied at least 25% in three months, the index was up by an average of 21.4% one year later. In comparison, the S&P 500 has averaged a 9.2% annualized return since 1950. In other words, the S&P 500 has, historically, more than doubled its average annual return following one of these rare launchpad moments.
What Detrick's data set speaks to is the nonlinearity of investment cycles, which overwhelmingly favors optimistic long-term investors.
In June 2023, researchers at Bespoke Investment Group compared the calendar-day length of every bull and bear market in the benchmark index dating back to the start of the Great Depression (September 1929). What they found was a night-and-day difference.
Whereas the average S&P 500 bear market has resolved in 286 calendar days (about 9.5 months) over a nearly 94-year period, the typical bull market endures for approximately 3.5 times as long — 1,011 calendar days (roughly two years and nine months).
No matter how worrisome elevator-down moves in the S&P 500, Dow Jones Industrial Average, and Nasdaq Composite may seem, they're historically short-lived and give way to some of Wall Street's best investment opportunities.


 Stock Sinks As Market Gains: Here’s Why")
 Outpaces Stock Market Gains: What You Should Know")


 Stock Sinks As Market Gains: Here’s Why")
 Stock Dips While Market Gains: Key Facts")