

Key takeaways:
-
Bitcoin hit a new all-time high of $124,450 on Thursday, and signs of overheating are starting to appear.
-
Several technical indicators suggest a potential top at $124,000.
Bitcoin (BTC) recorded a new all-time high of $124,450 during the early Asian trading hours on Thursday. However, BTC price had pulled back to $121,670 at the time of writing.
Despite the correction, there were mixed signals about whether the price rally had peaked or whether it was a healthy pullback.
Onchain data: Bitcoin price hasn’t peaked yet
Bitcoin was not showing any signs of peaking despite reaching new all-time highs on Thursday, with several onchain metrics suggesting Bitcoin could rise further.
Overheating indicators such as funding rate and short-term capital inflow remain low compared to previous peaks, and profit-taking by short-term investors was limited, according to data from CryptoQuant.
Related: Metaplanet outperforms Japan’s most liquid blue-chip stocks in 2025
Bitcoin’s funding rate, an indicator used to indicate an overheated market, shows an increase in long bets. However, these bets remain much smaller compared to previous peaks, suggesting that Bitcoin still has further to go before overheating conditions kick in.
A spike in Bitcoin funding rates can sometimes cause worry among market participants about increased Bitcoin volatility and liquidation risks.
Still, the funding rates are only moderately positive, signaling that traders are optimistic about Bitcoin’s price and buyers are willing to pay sellers a fee to hold their positions.
Meanwhile, the short-term holder (STH) Spent Output Profit Ratio (SOPR) metric reveals that few have taken profits during the recent rise despite STHs returning to profit.
This indicator is currently valued at 1.01%, suggesting that STHs are realizing some profits at much lower rates. Unlike in March 2024 and November 2024, profit-taking activity remains relatively subdued.
The 30 bull market peak indicators from CoinGlass suggest that Bitcoin shows no signs of overheating with $187,000 BTC price in play.
Other technicals say Bitcoin price “top might be in”
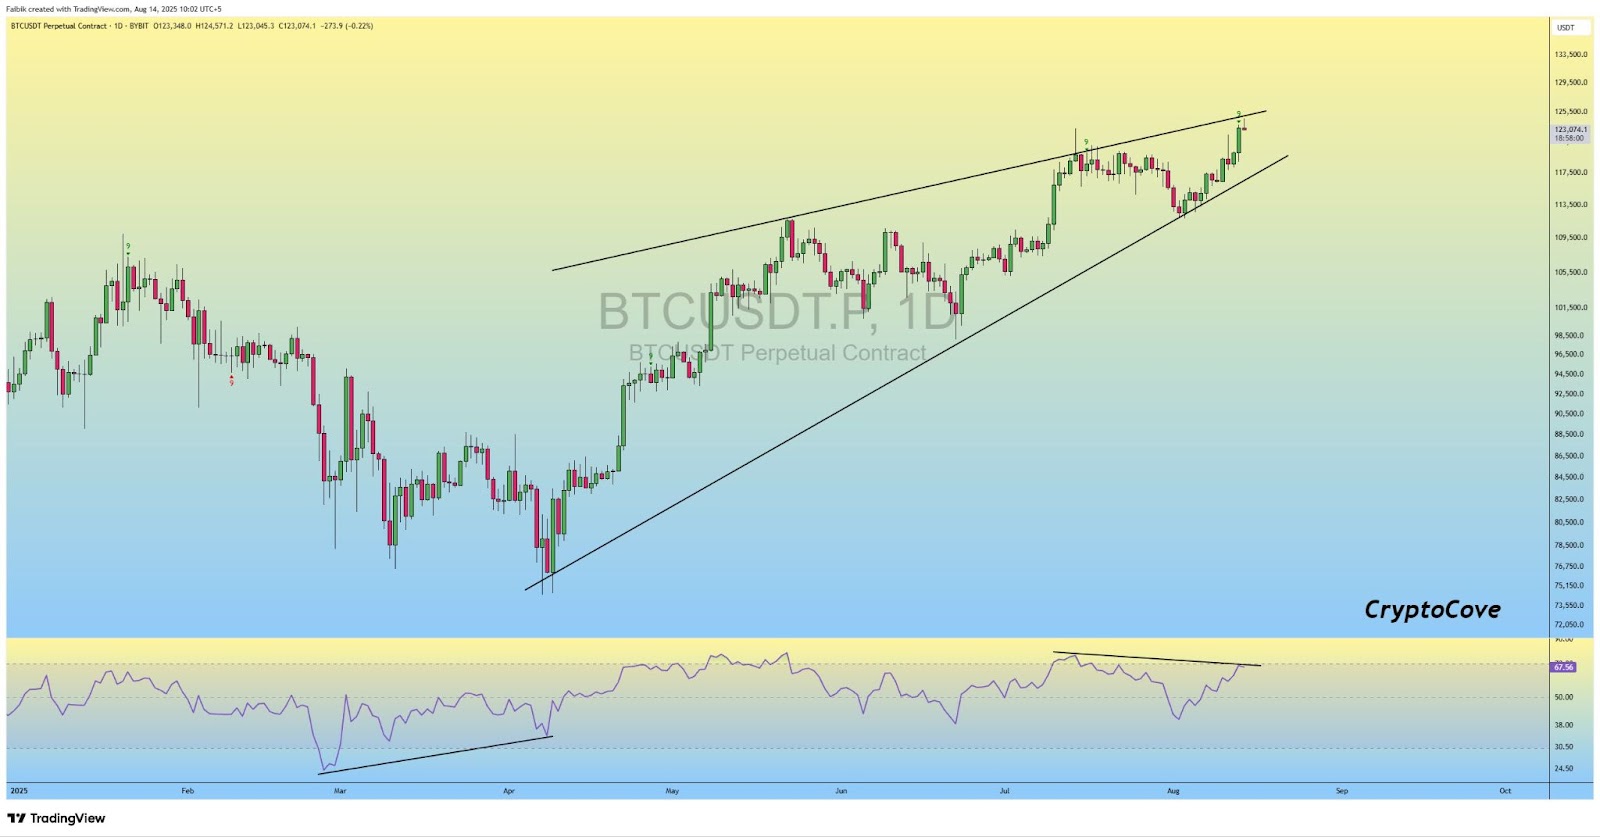
A combination of technical indicators suggests BTC price might have topped at $124,000, according to popular analyst Captain Faibik.
In his Bitcoin analysis on Thursday, the analyst said that after grabbing liquidity on its run to all-time highs, the BTC/USD pair has sent a number of bearish signals, including the appearance of the “9th TD sell candle” on the daily chart.
The bearish divergence from the daily relative strength index (RSI) shows weakening momentum, while the rising wedge formation indicates diminishing buying pressure, often preceding a price decline.
Captain Faibik wrote:
“This combination suggests the top might be in and a bearish rally could be around the corner.”
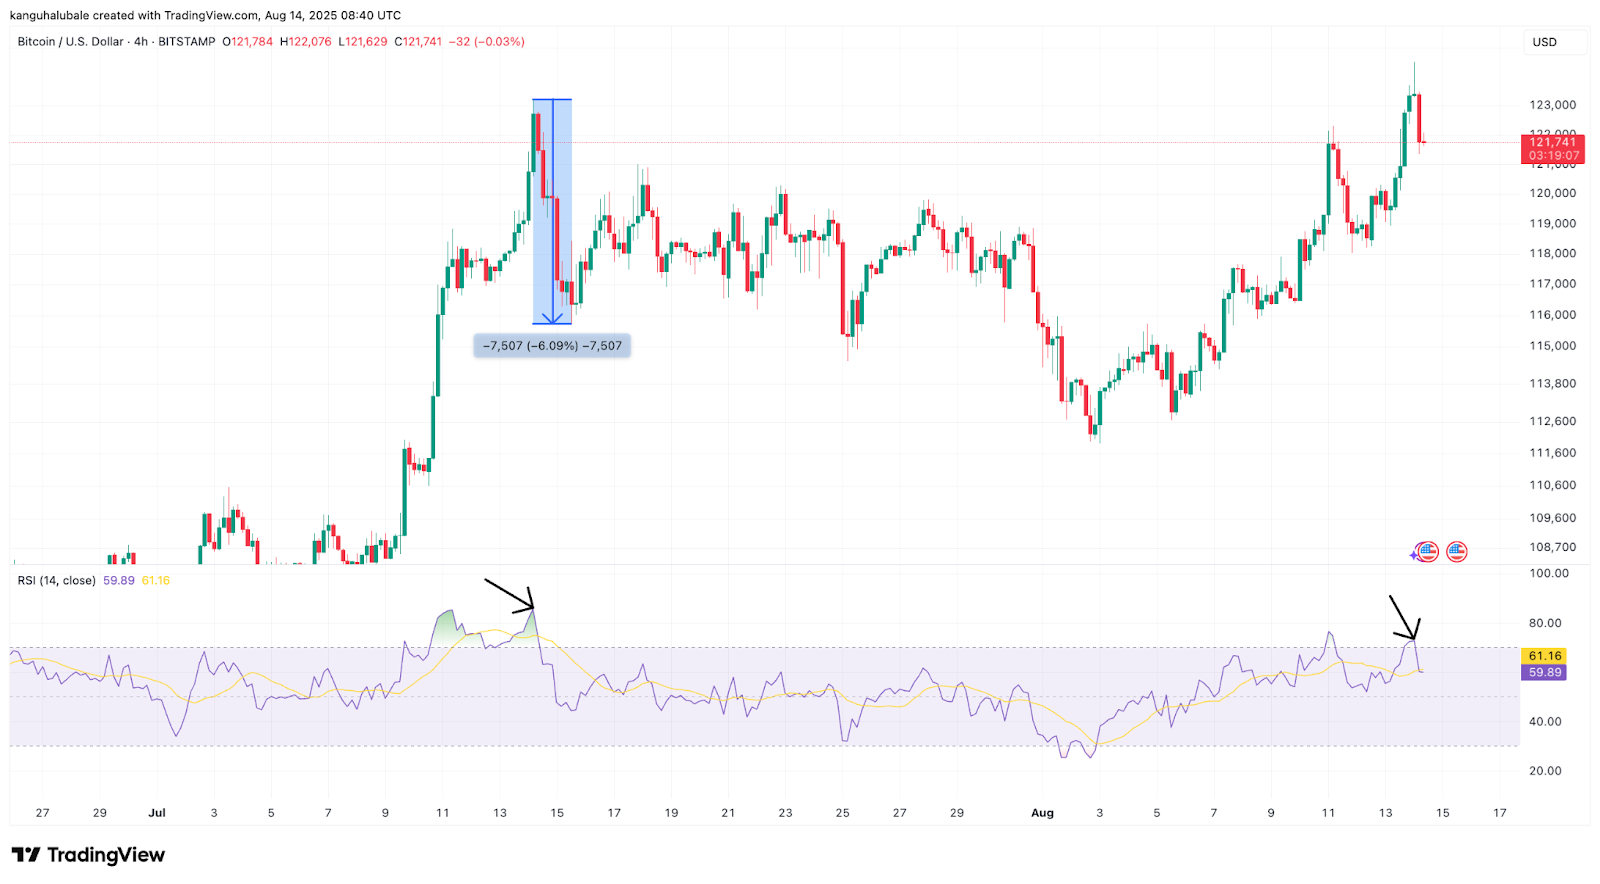
Bitcoin’s RSI shows a retracement after reaching overbought conditions on multiple time frames. Bitcoin’s RSI hit 72, 71 and 70 on the four-hour, 12-hour and daily charts, respectively, as BTC hit fresh all-time highs.
The retracement to $121,000 from $124,000 followed overbought conditions as shown on the chart below. Overbought conditions resulting from Bitcoin’s run to its previous all-time highs of $123,000 in July also preceded a 6% drawdown to $115,000.
Even though these metrics are warning of a possible pullback in the short term, it is important to note that RSI conditions do not always guarantee a trend reversal. Crypto prices are volatile, and BTC could continue to rally, fueled by increasing institutional demand and money supply growth.
This article does not contain investment advice or recommendations. Every investment and trading move involves risk, and readers should conduct their own research when making a decision.


