

Our 4×4 Asset Allocation philosophy approaches every asset or strategy based on how it contributes to — or detracts from — four goals: Growth, Income, Preservation, and Liquidity. In particular, under the 4×4 Goal Parity framework, each of these goals has equal weight.
So, what does a goals-based approach to equity factors look like from this perspective?
The literature on equity factors, particularly Eugene F. Fama and Kenneth R. French’s extended family of factors, is deep and extensive. These include Small Minus Big (SMB) and High Minus Low (HML), which respectively describe the difference between returns of small- and large-cap stocks and high book-to-market and low book-to-market stocks.
Among the factors of more recent vintage are Robust Minus Weak (RMW) and Conservative Minus Aggressive (CMA), or the difference in returns among companies with robust and weak operating profitability and between those that invest conservatively and aggressively. The Kenneth R. French Data Library also features Momentum (Mom), or the return spread between winners and losers over the last 12 months, as well as Short-Term and Long-Term Reversal factors (ST_Rev, LT_Rev).
While many researchers focus on each factor’s stand-alone performance metrics, we are more concerned with the relationships among the factors themselves, their (non-linear) relationships with larger market and macroeconomic conditions, and ultimately each factor’s role in a goals-based, investor-specific portfolio.
How do the simple correlations between factors compare? The market’s excess return (Mkt-RF) is negatively correlated with Mom, HML, and RMW, a frequent proxy for Quality. Mkt-RF is most negatively correlated, however, with CMA, which may be a “management behavior quality” factor and perhaps a quality or defensive factor. That is, aggressively investing executives engaged in empire-building activities may do well when capital is flowing but suffer in market downturns. Conservative firms, on the other hand, save cash for rainy days and rely less on external financing. HML and CMA have a 68% correlation. This could be because investors place higher valuation multiples on firms with fast-growing assets than on their slower-asset-growing peers. In any case, based on empirical correlations, HML is a defensive factor as well since Value tends to do well in recessions.
Fama–French Factor Correlations, July 1963 to December 2022
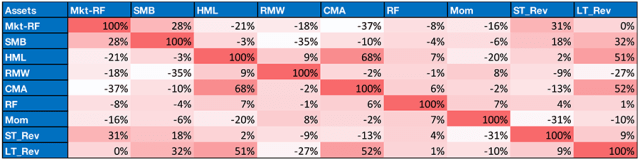
Methodology: Standard Pearson correlation coefficients computed with monthly returns.
But what does a non-linear analysis of the factors reveal when we compare their skewness and convexity with respect to major risk factors, such as Mkt-RF, monthly changes in 10-year Treasury yields, monthly changes in money-market or “risk-free” rates (RF), and month-on-month changes of the CPI-U index?

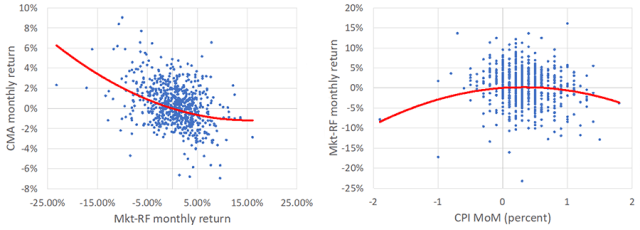
Convexity reflects the co-skewness coefficient between a Fama–French factor and two instances of a risk factor squared. In particular, the co-skewness of Mkt-RF with itself is simply Mkt-RF skewness. If a Fama–French factor has positive co-skewness with a risk factor, it is convex with respect to that risk factor. If it has negative co-skewness, it is concave. For example, Mkt-RF is concave with respect to CPI MoM while CMA is convex with respect to Mkt-RF.
Fama–French Factor Skewness and Convexity, July 1963 to December 2022
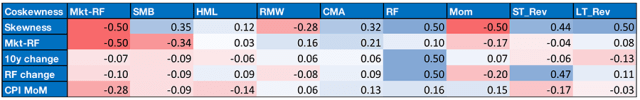
Red cells represent negative and blue cells positive co-skewness values.
Skewness and co-skewness coefficients computed with monthly returns and bounded by [-0.5,0.5].
Convexity relative to a major risk factor indicates better performance in crises driven by rapid changes in interest rates, inflation, or sharp market declines. Heuristically, convexity should contribute to our (real capital) Preservation goal. Conversely, concave, negatively skewed assets and strategies may behave like income-generating corporate bonds and equities, delivering their best performance in placid environments but underperforming in crises.
Convexity and Concavity: CMA vs. Mkt-RF and Mkt-RF vs. CPI MoM
In 4×4 Goal Parity we quantify this intuition with two investor-specific parameters: strategic horizon and loss tolerance. In particular, we look at Fama–French factors from 1963 to 2022. Given a 10-year strategic horizon and a 15% loss tolerance, our methodology demonstrates the following:
- Value (HML) makes a significant Preservation contribution, providing some protection in recessions.
- CMA and LT_Rev factors are even better Preservation factors. In particular, HML, CMA and LT_Rev did very well in 2022 when both stocks and bonds declined.
- RMW overlaps with Quality and High Dividend equities and contributes more to Income.
- Twelve-month window Mom contributes to Income as well. Faster Mom would deliver more Preservation.
4×4 Asset Map: Investor Goals and Fama–French Factors, July 1963 to December 2022
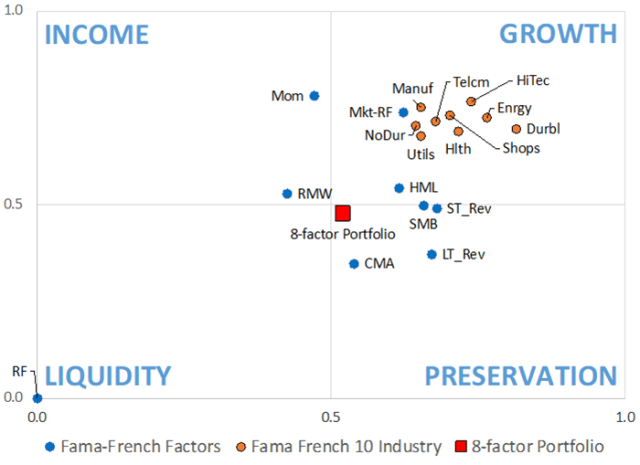
Strategic horizon 𝑇=10 years, “substantial loss” barrier B=85%. The eight-factor portfolio includes equal weights of Mkt-RF, SMB, HML, RMW, CMA, Mom, ST_Rev, and LT_Rev.
Sources: 4x4invest’s proprietary methodology; Kennneth R. French’s Data Library
From our goals-based perspective (or a macro lens perspective), Fama–French factors play quite different roles.
So, should investors build diversified factor portfolios balanced across all of our 4×4 goals? To start answering this question, we built an equal-weighted portfolio of eight Fama–French factors — Mkt-RF, SMB, HML, RMW, CMA, Mom, ST_Rev, and LT_Rev — and rebalanced it monthly.

From 1963 to 2022, the eight-factor portfolio lags Mkt-RF during bull markets but does much better during bear markets and with lower volatility. The portfolio achieves a Sharpe ratio of 1.16 versus 0.42 for Mkt-RF without accounting for transaction costs. Perhaps excess equity market returns reflect GDP growth in the large and relatively closed US economy. From this perspective, the eight-factor portfolio’s performance pattern more resembles that of US nominal GDP, with a much lower “tracking error.”
Mkt-RF and Eight-Factor Portfolio vs. US Nominal GDP Growth, July 1963 to December 2022
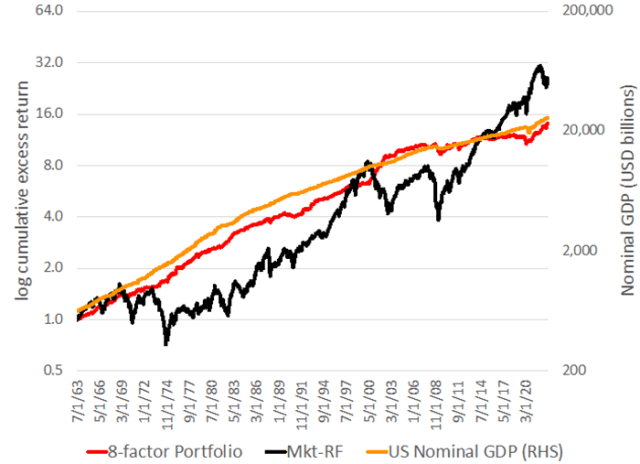
The eight-factor portfolio includes equal weights of Mkt-RF, SMB, HML, RMW, CMA, Mom, ST_Rev, and LT_Rev. 4x4invest’s calculations for illustration and educational purposes only. Past performance is not indicative of future results.
The 4×4 Asset Map above shows that the equal-weighted eight-factor portfolio comes pretty close to a 4×4-optimal Goal Parity portfolio, with equal weight on Growth, Income, Preservation, and Liquidity. The relationships among the different factors vary over the six-decade examination period. Nevertheless, “powering” all four goals may have delivered the diversification benefits necessary to achieve resilient performance across the bear markets of 1972 to 1974, 2000 to 2002, and 2007 to 2009, as well as 1969 and 2022 when both stocks and bonds disappointed.
Factor Performance in Bear Markets
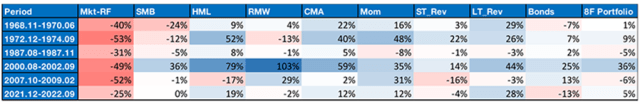
Sources: Kenneth R. French Data Library, Bloomberg. 4x4invest’s calculations are for illustration and educational purposes only. Past performance is not indicative of future results.
In practice, portfolios encompassing all major asset classes deploy factors far beyond the Fama–French universe. Balanced and customized Goal Parity factor portfolios may provide investors with competitive returns and a smoother overall ride — if they seek crisis capital Preservation and manage their fear of missing out (FOMO) during bull markets.
If you liked this post, don’t forget to subscribe to the Enterprising Investor.
All posts are the opinion of the author. As such, they should not be construed as investment advice, nor do the opinions expressed necessarily reflect the views of CFA Institute or the author’s employer.
Image credit: ©Getty Images/Hanis
Professional Learning for CFA Institute Members
CFA Institute members are empowered to self-determine and self-report professional learning (PL) credits earned, including content on Enterprising Investor. Members can record credits easily using their online PL tracker.


