

It’s been only a little more than a month since the US Presidential election, and already analysts’ heads are spinning over the potential impact of trade policy. President-elect Trump has made numerous tariff threats, leaving researchers to wonder which, if any, he’ll follow through on — and what the consequences for asset prices might be.
Academic economists overwhelmingly dislike tariffs for a variety of reasons. Chief among them is that they help the few at the expense of the many and likely sap long-term economic growth.[i]
Recent research suggests that the targeted tariffs in 2018 and 2019 had only a brief effect on financial markets.[ii] In a Liberty Street blog, economists at the New York Fed showed that large-cap US equities responded negatively to tariffs imposed during the first Trump Administration at the time of their announcement, but not before. [iii] That is when tariffs hit, stocks fell, at least for a time. Specifically, researchers found that US stocks fell on the day tariffs were announced (tariff day), and that this change was robust to other economic news that might plausibly affect stock prices.
In this blog, using a similar but simpler approach, I extend parts of their analysis to small-cap US equities and small-cap equities in major foreign markets. I explicitly show the change in response to tariffs of a safe asset (the 10-year US Treasury) and expected volatility (as proxied by the VIX). Additionally I test the claim that average returns on tariff announcement days were indeed different from non-tariff-announcement days.
I confirm that tariff announcement days were indeed bad for equities, here and abroad. Safe-haven assets (proxied by the U.S. 10-year Treasury) protected capital, just as an investor would have hoped. Tariffs also appear to have had no lasting effects on expected US stock market volatility. The VIX reverts to pre-tariff levels quickly after a tariff shock.
These responses are unlikely to have happened by chance — though we can’t rule out possible bias.
My analysis is performed in R, and data used is available from Yahoo Finance and FRED. Tariff dates are taken from the New York Fed’s blog.[iv] For those who want to replicate or change the analysis, R Code is available online.
What Happened on Tariff Day?
Table 1 shows, by tariff day date, the one-day price-return percentage change for the S&P 500 index (sp_chg), the Russell 2000 index (rut_chg), the FTSE 100 index (ftse_chg), the DAX index (dax_chg), the Nikkei 225 index (nikkei_chg), and the Hang Seng index (hsi_chg) on the 10 days Tariffs were imposed. In the case of the VIX (vol_chg) 10-year U.S. Treasury (ten_chg), differences in levels are used. On some tariff-announcement dates, certain foreign markets were closed, in which case returns were “NA.”
Tariff announcements on average coincided with falling equity markets, rising 10-year US Treasury prices, and heightened expected volatility, as the New York Fed’s researchers found.
Table 1. What happened when the 2018 and 2019 tariffs hit.
| date | sp_chg | rut_chg | ftse_chg | dax_chg | nikkei_chg | hsi_chg | vol_chg | ten_chg |
| 2018-01-23 | 0.217 | 0.345 | 0.213 | 0.712 | 1.292 | 1.659 | 0.070 | -0.030 |
| 2018-03-01 | -1.332 | -0.335 | -0.778 | -1.969 | -1.558 | 0.647 | 2.620 | -0.060 |
| 2018-03-22 | -2.516 | -2.243 | -1.227 | -1.698 | NA | -1.093 | 5.480 | -0.060 |
| 2018-03-23 | -2.097 | -2.189 | -0.442 | -1.767 | -4.512 | -2.452 | 1.530 | -0.010 |
| 2018-06-15 | -0.102 | -0.048 | -1.698 | -0.737 | 0.498 | -0.429 | -0.140 | -0.010 |
| 2018-06-19 | -0.402 | 0.058 | -0.359 | -1.217 | -1.772 | NA | 1.040 | -0.030 |
| 2019-05-06 | -0.447 | 0.059 | NA | -1.014 | NA | -2.898 | 2.570 | -0.030 |
| 2019-05-13 | -2.413 | -3.178 | -0.550 | -1.519 | -0.720 | NA | 4.510 | -0.070 |
| 2019-08-01 | -0.900 | -1.515 | -0.025 | 0.526 | 0.090 | -0.763 | 1.750 | -0.120 |
| 2019-08-23 | -2.595 | -3.088 | -0.466 | -1.154 | 0.402 | 0.501 | 3.190 | -0.100 |
| MEAN | -1.259 | -1.213 | -0.593 | -0.984 | -0.785 | -0.604 | 2.262 | -0.05 |
Source: Yahoo Finance, FRED
Effect Significance
The changes in Table 1 appear large, but they could be due to chance. To strengthen the main finding that tariffs are bad for stocks, at least in the short run, I estimate models of the form:
Daily Change = Constant + Tariff + Error, where Tariff is a dummy variable using simple linear regression. Results from this comparison of means are reported in Table 2.
Estimates of the effect of tariffs are shown in the first row (Tariff), while average returns on non-tariff days are shown in the second row (Constant). Standard errors are in parenthesis below each estimate, and significance is denoted by asterisks using the typical convention, as explained in the table note.
Mean values in the last row of Table 1 are of course exactly equal to Tariff coefficient plus constant estimates in Table 2. We didn’t need to run regressions to estimate the mean effect. Rather, the value in this exercise is in the error estimates, which allow us to determine significance.
Table 2. Regression results.
| Dependent variable | ||||||||
| sp_chg | rut_chg | ftse_chg | dax_chg | nikkei_chg | hsi_chg | vol_chg | ten_chg | |
| Tariff | -1.321*** | -1.258** | -0.605* | -1.022*** | -0.818* | -0.585 | 2.273*** | -0.053*** |
| (0.394) | (0.506) | (0.343) | (0.390) | (0.461) | (0.522) | (0.660) | (0.018) | |
| Constant | 0.062** | 0.045 | 0.013 | 0.038 | 0.033 | -0.019 | -0.011 | 0.001 |
| (0.030) | (0.038) | (0.025) | (0.030) | (0.033) | (0.037) | (0.050) | (0.001) | |
| Observations | 1,743 | 1,743 | 1,679 | 1,689 | 1,549 | 1,589 | 1,743 | 1,742 |
| R2 | 0.006 | 0.004 | 0.002 | 0.004 | 0.002 | 0.001 | 0.007 | 0.005 |
| Note: *p<0.1; **p<0.05; ***p<0.01 | ||||||||
| Source: Yahoo Finance, author’s regressions | ||||||||
The effect of tariff announcements on large-cap stocks is highly significant (t-statistic = 3.4), while the effect on small-cap stocks is less so (t = 2.5). The accuracy of the estimate of foreign markets to tariff announcements is a mixed bag. Only the DAX’s response estimated remotely accurately (t = 2.6). Interestingly, Hang Seng index mean returns aren’t different, statistically, on tariff announcement days. On these days, tariffs appear to hurt US and other developed-market equities more than Chinese equities. Meanwhile, reactions of safe assets (t = 2.9) and volatility (t = 3.4) to tariffs are of the expected sign and reasonably strong. (Technical note: using “robust” standard errors doesn’t change these conclusions).
The skeptical reader may still question causality. My simple model has no controls. I haven’t attempted to rule out other possible influences on the dependent variable. The New York Fed’s researchers, however, did do this — admittedly only for US equities — and it didn’t change their conclusions.
Since checking robustness of my results to other economic developments would change this from a short blog post into a full-blown research project, I rely on their finding that tariff days did not also witness unrelated market-moving developments, leaving a more rigorous treatment to future research.
Tariff Volatility Vanishes
Readers may recall that equity markets were weak in 2018 and quite strong in 2019. This suggests that, in the scheme of things, the negative impact of tariffs of the kind imposed during that period might just be a blip. If we use the persistence of the change in VIX as a measure of the disruptiveness of tariffs, this appears to be the case.
Chart 1 shows the VIX level in 2018 and 2019, where tariff days are denoted by red triangles and non-tariff days by black dots. Table 3 shows the level of the VIX one day prior to tariff days (col. 2), then on tariff day (col. 3), then three, five, and 10 days after tariff day (cols. 4 through 7).
Quick visual inspection of Chart 1 reveals that VIX spikes usually reverse quickly after tariff days. Table 3 allows for a more precise conclusion: on 70% of tariff days in 2018 and 2019, the VIX returned to its pre-tariff level in the following week or so.
Finally, and more rigorously, I checked persistence (autocorrelation) of VIX levels and changes day to day and find no difference on average at or around tariff days relative to non-tariff days. The effect of tariff announcements on VIX is fleeting.
Chart 1. VIX level, 2018 to 2019.
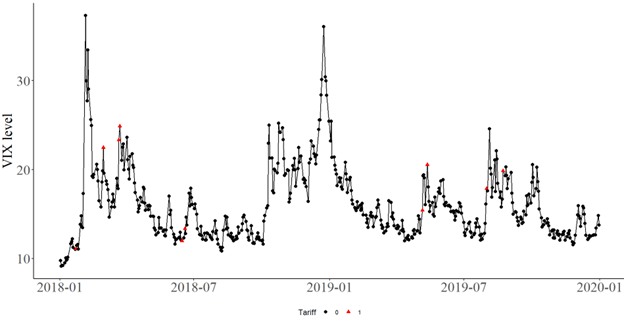
Source: Yahoo Finance
Table 3. VIX pre- and post-Tariff.
| date | pre_Tariff | Tariff | post_one | post_three | post_five | post_ten |
| 2018-01-23 | 11.03 | 11.10 | 11.47 | 11.08 | 14.79 | 29.98 |
| 2018-03-01 | 19.85 | 22.47 | 19.59 | 18.36 | 16.54 | 16.59 |
| 2018-03-22 | 17.86 | 23.34 | 24.87 | 22.50 | 19.97 | 21.49 |
| 2018-03-23 | 23.34 | 24.87 | 21.03 | 22.87 | 23.62 | 21.77 |
| 2018-06-15 | 12.12 | 11.98 | 12.31 | 12.79 | 13.77 | 16.09 |
| 2018-06-19 | 12.31 | 13.35 | 12.79 | 13.77 | 15.92 | 16.14 |
| 2019-05-06 | 12.87 | 15.44 | 19.32 | 19.10 | 20.55 | 16.31 |
| 2019-05-13 | 16.04 | 20.55 | 18.06 | 15.29 | 16.31 | 17.50 |
| 2019-08-01 | 16.12 | 17.87 | 17.61 | 20.17 | 16.91 | 21.18 |
| 2019-08-23 | 16.68 | 19.87 | 19.32 | 19.35 | 18.98 | 15.27 |
Source: Yahoo Finance, author’s calculations
All Sound and Fury, with a Caveat
On the day when tariffs hit, returns in most equity markets were much smaller on average than on other days. And, though strength varies, the difference in most markets is significant. At the same time, the 10-year Treasury’s price rose on tariff days: high-quality bonds did their job. The overall impact of the type of tariffs used in 2018 and 2019, however, seems to have been short lived.
Though clients may expect us to follow every tariff tweet, we can perhaps take some comfort from the fact that, in the long term, the types of tariffs imposed in 2018 and 2019 didn’t matter much for capital market performance. The effect of broader tariffs, however, might not be so benign.
The author is a Registered Investment Advisor representative of Armstrong Advisory Group. The information contained herein represents his independent view or research and does not represent solicitation, advertising, or research from Armstrong Advisory Group. It has been obtained from or is based upon sources believed to be reliable, but its accuracy and completeness are not guaranteed. This is not intended to be an offer to buy, sell, or hold any securities.
[i] See for example https://www.cato.org/publications/separating-tariff-facts-tariff-fictions#how-has-united-states-used-tariffs, and https://www.aeaweb.org/articles?id=10.1257/jep.33.4.187
[ii] https://libertystreeteconomics.newyorkfed.org/2024/12/using-stock-returns-to-assess-the-aggregate-effect-of-the-u-s-china-trade-war/
[iii] Ibid
[iv] Ibid


