

When things seem too good to be true on Wall Street, they usually are.
Investors have endured one of the bumpiest rides on record through the first nearly seven months of the year.
In early April, the S&P 500 (^GSPC 0.02%) navigated its steepest two-day percentage decline since 1950, with the Nasdaq Composite (^IXIC 0.33%) dipping into its first bear market in three years. Since bottoming out on April 8, both indexes have rallied to multiple record-closing highs, with the ageless Dow Jones Industrial Average (^DJI -0.14%) a stone's throw away from logging its first all-time closing high since December.
While it would appear that the bulls are in firm control, with no end in sight to the current bull market, history would beg to differ.
Image source: Getty Images.
This is one of the priciest stock market's dating back to 1871
To preface the following discussion, no predictive tool or forecasting indicator can ever guarantee short-term directional moves in the S&P 500, Nasdaq Composite, or Dow Jones Industrial Average. If there were a surefire forecasting tool, you can rest assured that every investor would be using it by now.
However, there are certain correlative events and predictive indicators that have a solid or even flawless track records of forecasting future stock returns. One such tool is the valuation-based Shiller price-to-earnings (P/E) Ratio, which is also commonly referred to as the cyclically adjusted P/E Ratio, or CAPE Ratio.
Value is, itself, a very subjective topic. What one investor believes is a bargain might be viewed as pricey by another. The subjectivity of valuations is one of the reasons the stock market is so unpredictable.
When most folks assess value, they often lean on the time-tested P/E ratio, which divides a company's share price by its trailing-12-month earnings per share (EPS). The issue with the P/E ratio is that recessions and shock events can render it useless. This is where the S&P 500's Shiller P/E comes into play.
The Shiller P/E is based on average inflation-adjusted EPS over the prior 10 years. Since shock events and recessions tend to be short-lived, they can't skew the results for the Shiller P/E in the same way they can with the traditional P/E ratio.
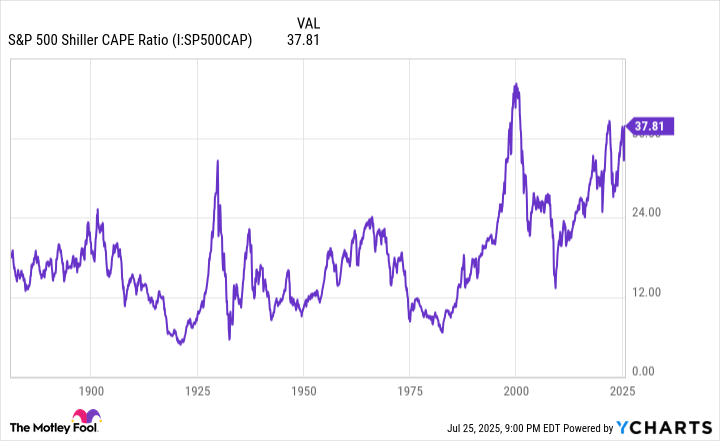
S&P 500 Shiller CAPE Ratio data by YCharts.
In December, the S&P 500's Shiller P/E hit a closing high during the current bull market of 38.89. But on Friday, July 25, it surpassed this mark with a closing multiple of 38.97. This is now, officially, the third-priciest continuous bull market when back-tested to January 1871.
There are only two previous instances where the Shiller P/E has been higher than 38.97 — and the end result wasn't pretty for investors either time:
- In December 1999, just months prior to the popping of the dot-com bubble, the S&P 500's Shiller P/E hit an all-time high of 44.19. On a peak-to-trough basis, the S&P 500 lost 49% of its value during the bursting of the dot-com bubble, while the Nasdaq Composite plummeted 78%.
- During the first week of January 2022, with fiscal stimulus fueling the U.S. economy and stock market, the Shiller P/E crept ever-so-slightly above 40. During the 2022 bear market, the benchmark index shed 25% of its value, with the Nasdaq peaking at a 36% decline.
In fact, all five prior occurrences (not including the present) where the Shiller P/E Ratio has surpassed 30 and held this level for at least two months were eventually followed by declines in one or more of the major stock indexes ranging from 20% to as much as 89% (during the Great Depression).
Although there's no rhyme or reason as to when Wall Street's major stock indexes will hit their respective tops, the S&P 500's Shiller P/E makes clear that premium valuations are a harbinger of trouble for the stock market. It's simply a matter of time before a sizable downdraft occurs.
Image source: Getty Images.
Elevator-down moves represent surefire buying opportunities for investors
The prospect of another elevator-down move for the S&P 500, Nasdaq Composite, and Dow Jones Industrial Average probably isn't what you want to hear with stocks staging one of their strongest intra-year comebacks in history. Nevertheless, elevator-down moves in stocks often provide some of the best investment opportunities.
Let's make one thing clear: Downdrafts in Wall Street's major stock indexes are unavoidable. No amount of fiscal and monetary policy maneuvering can stop corrections, bear markets, or the occasional crash from occurring. These are normal, healthy, and inevitable events.
But the most important thing to recognize about these often emotion-driven events is that they're short-lived.
In June 2023, the analysts at Bespoke Investment Group published a data set on X (previously Twitter) that calculated the calendar-day length of every bull and bear market for the S&P 500 dating back to the start of the Great Depression in September 1929.
On one hand, the average S&P 500 bear market has lasted for 286 calendar days, which is less than 10 months. On the other side of the coin, the typical bull market has endured for an impressive 1,011 calendar days, as of June 2023. In other words, the average bull market lasts about 3.5 times longer.
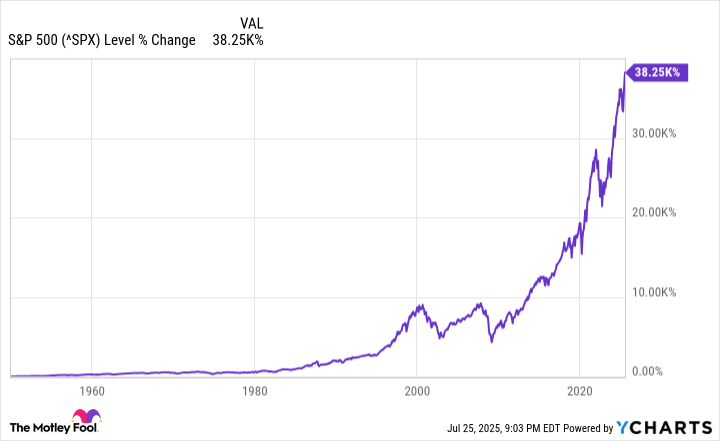
^SPX data by YCharts. The above chart only goes back to the start of 1950.
In addition to bull markets lasting disproportionately longer, a study from Crestmont Research finds that time is an undefeated ally of investors.
The analysts at Crestmont calculated the rolling 20-year total returns of the S&P 500, inclusive of dividends, back to the start of the 20th century. Even though the S&P didn't come into existence until 1923, the performance of its components was tracked in other major indexes back to 1900. This provided 106 separate 20-year periods of total return data.
Crestmont's newest data set shows that all 106 rolling 20-year periods produced positive annualized returns. Put simply, buying an S&P 500 tracking index (hypothetically speaking) at any point between 1900 and 2005 and holding it for 20 years would have made you money every single time.
Though it's a bit of a coin flip to predict how stocks will perform over the next couple of quarters, history conclusively shows that Wall Street's major indexes head higher over 20-year periods.


 Stock Sinks As Market Gains: Here’s Why")
 Outpaces Stock Market Gains: What You Should Know")


 Stock Sinks As Market Gains: Here’s Why")
 Stock Dips While Market Gains: Key Facts")