
Key point:
Fidelity Investments’ proposed spot Solana (SOL) exchange-traded fund has been delayed as the US Securities and Exchange Commission has asked for public comments within 21 days and rebuttals within 35 days.
Bloomberg ETF analyst James Seyffart said in a post on X that the delay was expected. In another post, Seyffart said that “interactions between the SEC and issuers/exchanges should be viewed positively.”
Could Solana rise above its overhead resistance in anticipation of a possible approval down the line? Let’s analyze the charts to find out.
SOL price prediction
Solana turned down from the 50-day simple moving average ($154) on Monday, indicating that the bears are fiercely defending the level.
A positive in favor of the bulls is that they have not allowed the price to dip and sustain below the 20-day exponential moving average ($149). The trading range is narrowing, signaling a possible breakout within the next few days.
If the price surges above $159, the momentum could pick up and the SOL/USDT pair could rally to $168 and eventually to $185.
On the contrary, if the price turns down and breaks below $144, it suggests the bulls have given up. That may pull the price down to $137 and later to $130.
Related: Ethereum ‘mega whales' are stacking harder than pre-95% rally in 2002
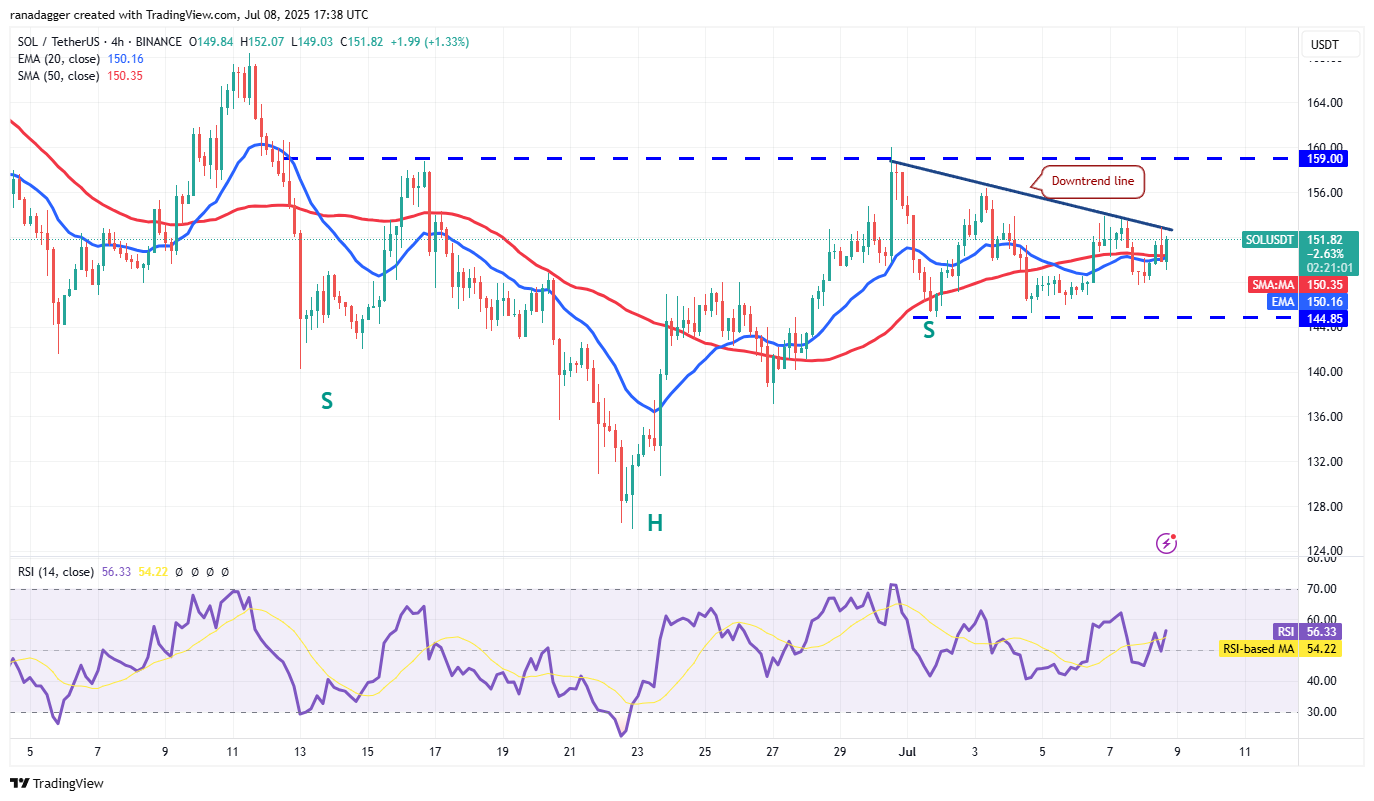
The pair has formed a bearish descending triangle pattern on the 4-hour chart, which will complete on a break and close below $144. That may start a downward move to $137 and then to the pattern target of $129.
Buyers have other plans. They are trying to push the price above the downtrend line, invalidating the bearish setup. If they manage to do that, the pair may climb to $159. This is a crucial level to watch out for because a close above $159 will complete an inverse head-and-shoulders pattern, which has a target objective of $192.
This article does not contain investment advice or recommendations. Every investment and trading move involves risk, and readers should conduct their own research when making a decision.


