
This metric has a 100% success rate of forecasting future stock market returns when back-tested over more than 150 years.
This has been a year investors won't soon forget. During a one-week stretch from the closing bell on April 2 to April 9, the benchmark S&P 500 (^GSPC -0.33%) endured its fifth-steepest two-day percentage decline dating back 75 years, as well as its largest single-day point gain since it was incepted. In fact, April 9 marked the largest single-session point gains for the iconic Dow Jones Industrial Average (^DJI -0.63%) and Nasdaq Composite (^IXIC -0.22%), as well.
For the S&P 500 and Dow, the late-March and early April tumult sent both indexes firmly into correction territory. As for the Nasdaq Composite, it endured its first bear market since 2022.
But oh, how the tables have turned.
In the three months since these major indexes bottomed on April 8, the S&P 500 and Nasdaq Composite have exploded to respective all-time highs, and the Dow is within a stone's throw of joining its peers.
Image source: Getty Images.
While everything would appear to be perfect for Wall Street, one historically flawless stock market predictor suggests trouble is brewing. When this forecasting tool makes history, “Look out below” eventually becomes a theme for the Dow, S&P 500, and Nasdaq Composite.
This predictive metric has a 100% success rate in forecasting future stock returns
To preface this discussion, understand that no forecasting tool, metric, or correlative event can, with guaranteed accuracy, predict the future. Though the following predictive indicator has never incorrectly forecasted what's to come, there's nothing that concretely guarantees the next directional move for Wall Street's major stock indexes.
With the above being said, the historically flawless forecasting tool that's on the verge of making history — and not in a good way — is the S&P 500's Shiller price-to-earnings (P/E) ratio, also known as the cyclically adjusted P/E ratio, or CAPE ratio.
When evaluating companies, most investors tend to rely on the time-tested P/E ratio, which divides a company's share price by its trailing-12-month earnings per share (EPS). This quick and easy valuation metric works wonders for mature businesses and during long-winded periods of economic expansion. However, it often fails to offer much substance for growth stocks or during recessions.
Thus enters the S&P 500's Shiller P/E ratio, which is based on average inflation-adjusted EPS over the trailing decade. Accounting for 10 years of earnings history and adjusting for inflation ensures the closest thing to an apples-to-apples valuation comparison over time.
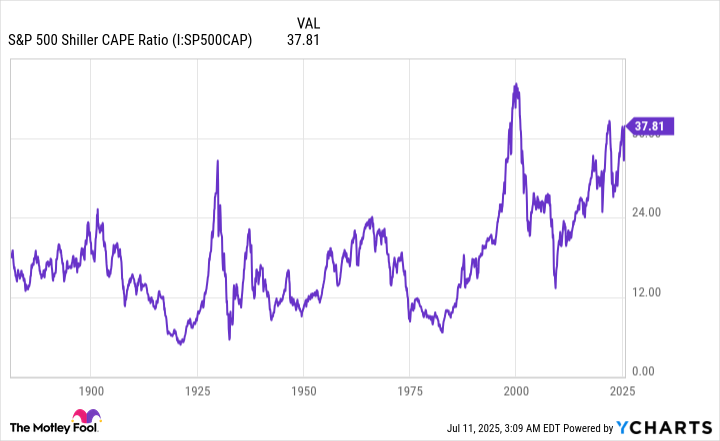
S&P 500 Shiller CAPE Ratio data by YCharts. CAPE Ratio = cyclically adjusted price-to-earnings ratio.
As of the closing bell on July 10, with the broad-based S&P 500 clocking in at a fresh record high, the Shiller P/E ended at a multiple of 38.26. Though this is still well off its record multiple of 44.19 set during the dot-com bubble and below the multiple of just over 40 achieved during the first week of January 2022, it's edging very close to the 38.89 peak logged in December during the current bull market cycle.
In other words, the stock market is knocking on the door of its third-priciest valuation multiple in history (during a continuous bull market), when back-tested over 154 years.
Why's this relevant? There have been only six unique instances, dating back to January 1871, where the S&P 500's Shiller P/E ratio has surpassed 30 and held that mark for at least two months. Following the five prior occurrences, the Dow Jones Industrial Average, S&P 500, and/or Nasdaq Composite eventually plunged by 20% to 89%.
What should be made clear here is that the Shiller P/E isn't a timing tool in any way. Sometimes the Shiller P/E remains above 30 for a very short period, as it did prior to the start of the Great Depression in the summer of 1929. On other occasions, we've witnessed the Shiller P/E maintain a multiple above 30 for more than four years, such as prior to and during the bursting of the dot-com bubble.
But what this flawless predictive tool has demonstrated is an uncanny track record of foreshadowing significant downside in equities. It's a harbinger of trouble for the stock market, and a multiple of 38.26 signals that valuations are extended and unsustainable.

Image source: Getty Images.
There's a silver lining, as well
If history were to rhyme, once more, Wall Street's major stock indexes will dip into a bear market at some point in the presumed not-too-distant future. On the surface, this probably doesn't sound like an enticing forecast for investors. However, it's actually a silver lining in disguise.
When stock market corrections and bear markets occur, it's not uncommon for investors to be worried or for their emotions to come into play. In late March and early April, for example, the market's major indexes fell at a much faster pace than they had risen. This is part of the old adage that stocks “take the stairs up and the elevator down.”
But there's a nonlinearity to Wall Street's ebbs and flows that unequivocally benefits patient and optimistic investors.
In June 2023, with the S&P 500 having risen 20% from its October 2022 bear market bottom, the benchmark index was officially in a new bull market. That's when analysts at Bespoke Investment Group published a data set on X (formerly Twitter) that compared the calendar-day length of every S&P 500 bull and bear market dating back to the start of the Great Depression in September 1929.
It's official. A new bull market is confirmed.
The S&P 500 is now up 20% from its 10/12/22 closing low. The prior bear market saw the index fall 25.4% over 282 days.
Read more at https://t.co/H4p1RcpfIn. pic.twitter.com/tnRz1wdonp
— Bespoke (@bespokeinvest) June 8, 2023
On one end of the spectrum, the 27 separate S&P 500 bear markets have stuck around for an average of only 286 calendar days. Furthermore, none of these 27 bear markets surpassed 630 calendar days in length.
On the other end of the spectrum, the typical S&P 500 bull market endured for 1,011 calendar days, or approximately 3.5 times longer than the usual bear market. What's more, if the current S&P 500 bull market, which began in October 2022, were extrapolated to present day, it would mean more than half of all bull markets (14 out of 27) have lasted longer than the lengthiest bear market.
What all this data implies is that bear markets tend to be short-lived and are surefire buying opportunities for investors with an optimistic, long-term mindset. Just as the Shiller P/E has a flawless track record of forecasting eventual downside of at least 20% in Wall Street's major indexes, more than a century of stock market history shows the major indexes climb in value over time.
If this correlation proves accurate, once again, approach it as a gift to buy stakes in high-quality stocks and/or exchange-traded funds (ETFs) at an attractive price.


")


 Stock Sinks As Market Gains: Here’s Why")
 Outpaces Stock Market Gains: What You Should Know")


 Stock Sinks As Market Gains: Here’s Why")
 Stock Dips While Market Gains: Key Facts")