
The stock market has enjoyed a rip-roaring run since President Donald Trump paused most reciprocal tariffs on April 9. The S&P 500 gained 30% from its low on April 8th through last week's high, while the tech-heavy Nasdaq Composite returned 42%.
The rally surprised many investors, given that most expected tariffs would eventually cause inflation to spike, slowing economic activity, increasing unemployment, and denting corporate revenue and profit growth.
Those concerns caused stocks to fall sharply from mid-February through early April. However, since then, investors have focused instead on the likelihood that tax stimulus from the One Big Beautiful Bill Act would largely offset the drag on the economy from tariffs, allowing companies and the U.S. economy to sidestep a reckoning.
Related: Stocks risk ‘Wile E. Coyote' moment
So far, that seems wise, given that, according to FactSet, S&P 500 members reported 11.9% earnings growth in the second quarter. FactSet's latest data suggests third-quarter earnings will grow 7.5%.
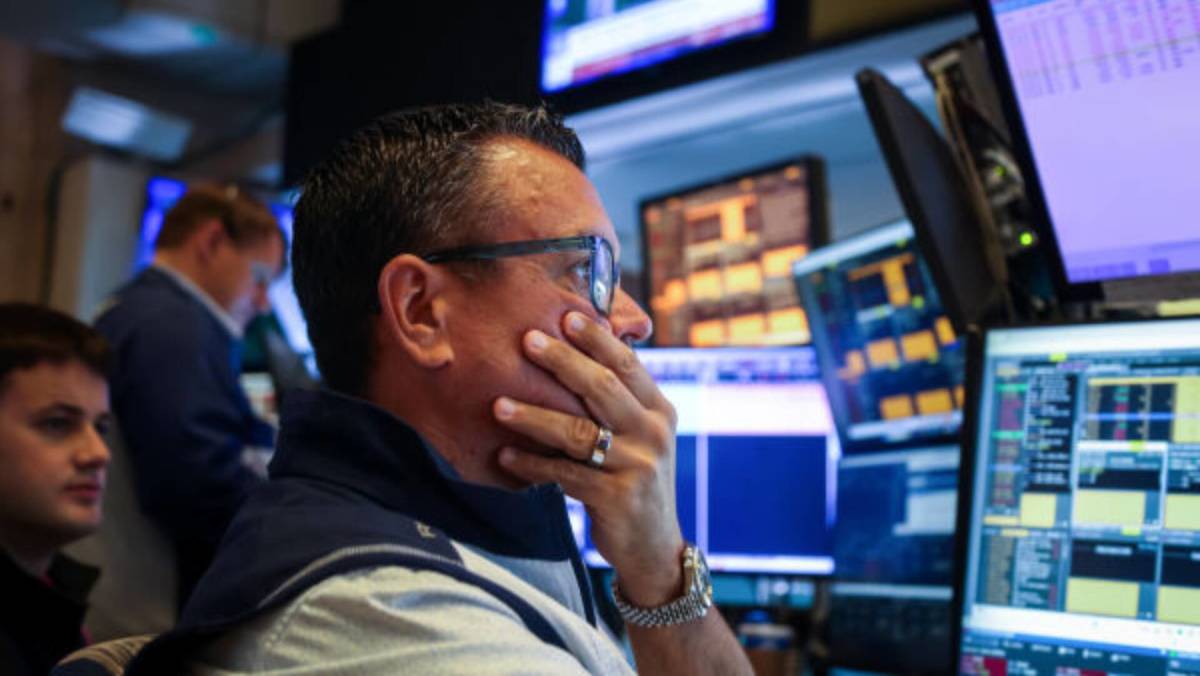
Still, market jitters may be returning, given that stocks retreated on Friday before the long Labor Day weekend and continued falling on Sept. 2nd when markets reopened for trading.
The S&P 500 fell 0.69% on the session, while the Nasdaq Composite was down 0.82%, slightly better than the 1.3% and 1.5% drops near midday.
That's certainly not terrible, but it may be concerning, given that many of the market's best performers, including AI high flyers, have been down more recently. For instance, Nvidia is 8% below its mid-August peak, and Palantir is down 17% from its August highs.
With a jobs report critical to what's next for interest rates looming on Sept 5, investors are locking in gains to avoid the risk associated with any unemployment surprises.
Economic uncertainty increases ahead of jobs report
The S&P 500 delivered back-to-back 20%-plus returns in 2023 and 2024, including an impressive 24% gain last year.
Optimism that the Federal Reserve would pivot from hawkish high interest rates to dovish monetary policy as it moved from battling inflation to boosting employment fueled those gains.
Related: Veteran trader breaks down the ‘September Effect' on the S&P 500
As expected, the Fed cut rates in September, November, and December last year, but it has remained neutral this year, nervous that more cuts plus tariffs would send inflation surging.
The Fed's inflation worries aren't without merit, given the Consumer Price Index showed inflation at 2.7% in July, up from 2.3% in April, and above the Fed's 2% target.
Still, the Fed's mandate is low inflation and unemployment, and the job market weakness that prompted it to lower rates late last year remains a problem.
As a result, many investors expect embattled Fed Chairman Jerome Powell to finally take his foot off the brake and lower rates at their next meeting on September 17.
Whether that happens, however, will hinge on what inflation and jobs data suggest between now and then. That means a lot is at stake for the BLS' unemployment report, which will land on Friday, Sept. 5.
“The big news this week is expected to be Friday’s August payroll report,” said veteran fund manager Louis Navellier. “We are in an environment where bad news will be considered good news, since financial markets are expecting a key interest rate cut by the FOMC on September 17th.”
Unemployment report could signal Fed rate cuts
The World Bank estimates that U.S. GDP will drop 1.4% in 2025 from 2.8% in 2024, pressuring employers to cut labor costs.
We're already seeing an uptick in layoffs. According to Challenger, Gray, & Christmas, 806,383 have lost their jobs year-to-date in 2025 through July, up 75% from 2024. In July, employers announced 62,075 layoffs, up 140% from last year. The company will update its figures for August on Thursday, Sept. 4.
More Economic Analysis:
- Fed official sends bold 5-word message on September rate cuts
- New inflation report may have major impact on your wallet
- Surprising GDP report resets backdrop for stocks
The steady pace of lost jobs has contributed to the unemployment rate clocking in at 4.2% in July, up from a cycle low of 3.4% in 2023. Most concerning, however, was that steep revisions to the May and June numbers showed only 33,000 jobs created in those months, well below the 291,000 initially reported.
Given the severity of those revisions, most will eagerly watch if the 73,000 jobs created in July are revised lower when the unemployment figures are updated later this week.
Investors will also be keying in on the unemployment rate itself. The unrounded unemployment rate in July was 4.248%, just shy of being rounded to 4.3%, marking a new cycle high and the largest figure since 2021.
The unrounded unemployment rate was the highest since October 2021.
“We expect the u-rate to be unchanged at 4.2% in Aug, signaling a stable labor market (Exhibit 4). But there is a risk that it rounds up to 4.3%, after the 4.248% Jul print,” said Bank of America analyst Shruti Mishra on Sept. 2 in a letter to clients.
If rounded unemployment also breaks out to the upside at 4.3%, it would improve the odds that the Fed reduces rates when it meets this month.
Currently, the CME FedWatch tool puts odds of a quarter-percentage-point rate cut this month at 92%.
However, it could also spook investors by suggesting that the Fed missed its window for keeping employment supported, increasing the risk it is behind the curve in efforts to avoid stagflation, a period of high inflation and unemployment, or worse, recession.
Unemployment rate by year since 2015:
- 2015: 5.3%
- 2016: 4.9%
- 2017: 4.4%
- 2018: 3.9%
- 2019: 3.7%
- 2020: 8.1%
- 2021: 5.3%
- 2022: 3.6%
- 2023: 3.6%
- 2024: 4%
Source: Statista
Stocks have priced in a lot of good news
The benchmark S&P 500 index is trading at a forward price-to-earnings (P/E) ratio of 22.4, higher than the five-year average of 19.9 and the 10-year average of 18.5. For perspective, according to FactSet, the ratio was about 19.4 at the April lows.
Historically, one-year returns for the S&P 500 have been negative when the forward S&P 500 P/E multiple is over 22.
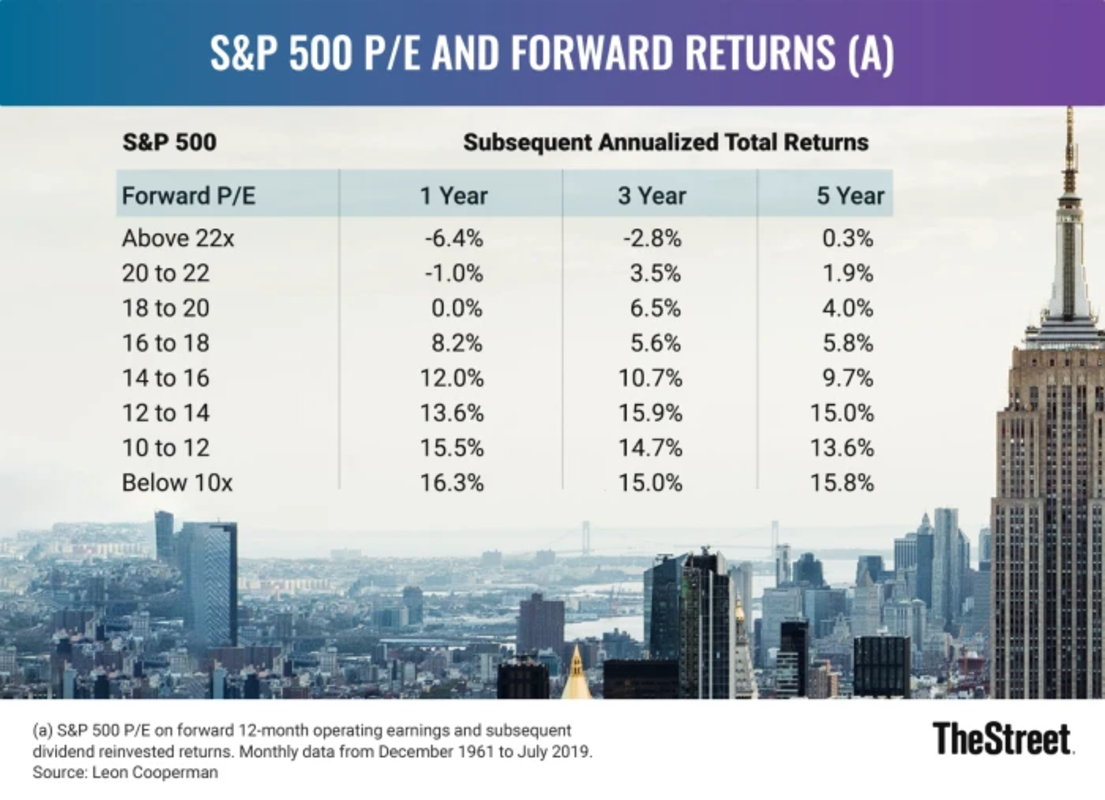
Image source: TheStreet
We're also in a very different place regarding sentiment than in April. At the springtime lows, most sentiment measures were deeply oversold. For example, CNN's Fear/Greed Index registered “Extreme Fear,” and the American Association of Individual Investors survey showed 61.9% of respondents bearish about the coming six months — the third-highest reading on record and the largest percentage since the stock market’s March 2009 lows during the Great Financial Crisis.
Additionally, the volatility index, or VIX, was over 50 in April, and the CBOE's put/call ratio, which measures bearish put-option to bullish call-option activity, was above 1.2, levels coincident with market rallies.
Those measures are now painting a different picture.
The Fear/Greed index is at “Greed.” AAII’s bearish responses have fallen to 39%, the VIX is below 19, and the put/call ratio is 0.83.
In short, the sentiment signals that sent shares surging in April are flashing warning signs now.
Of course, no signal is perfect, and stocks often rise and fall more than anyone thinks. They can also remain overbought and oversold for a while.
Still, antsy-ness ahead of jobs numbers suggests that the stock market could experience some backfilling of its recent gains as profit-takers emerge and worries about the economy resurface.
Related: Consumer confidence sends worrisome signal on economy, inflation


