

Key takeaways:
-
The Bitcoin Implied Volatility Index has fallen to its lowest level since September 2023, hinting at a potential breakout.
-
The short-term holder realized cap drawdown is at -8%, which is historically a bullish accumulation zone.
Bitcoin’s (BTC) recent price action points to a phase of quiet accumulation, but data shows that these low-volatility scenarios rarely last long.
The 30-day implied volatility index (BVIV) for BTC has dropped to 40.84, falling below the threshold at 45, a level breached only 21 times over the past 149 weeks (since September 2022). Historically, this zone has preceded periods of accumulation or local bottoms, and was followed by strong upward moves. Notably, the last time BVIV hovered this low, in September 2023, BTC rallied nearly 50% from $26,000.
Since late 2022, every weekly close below 45 on the BVIV matched with periods of price consolidation or significant bullish reversals in Bitcoin, reinforcing the idea that the current volatility compression could once again set the stage for an upward breakout, if historical patterns hold true.
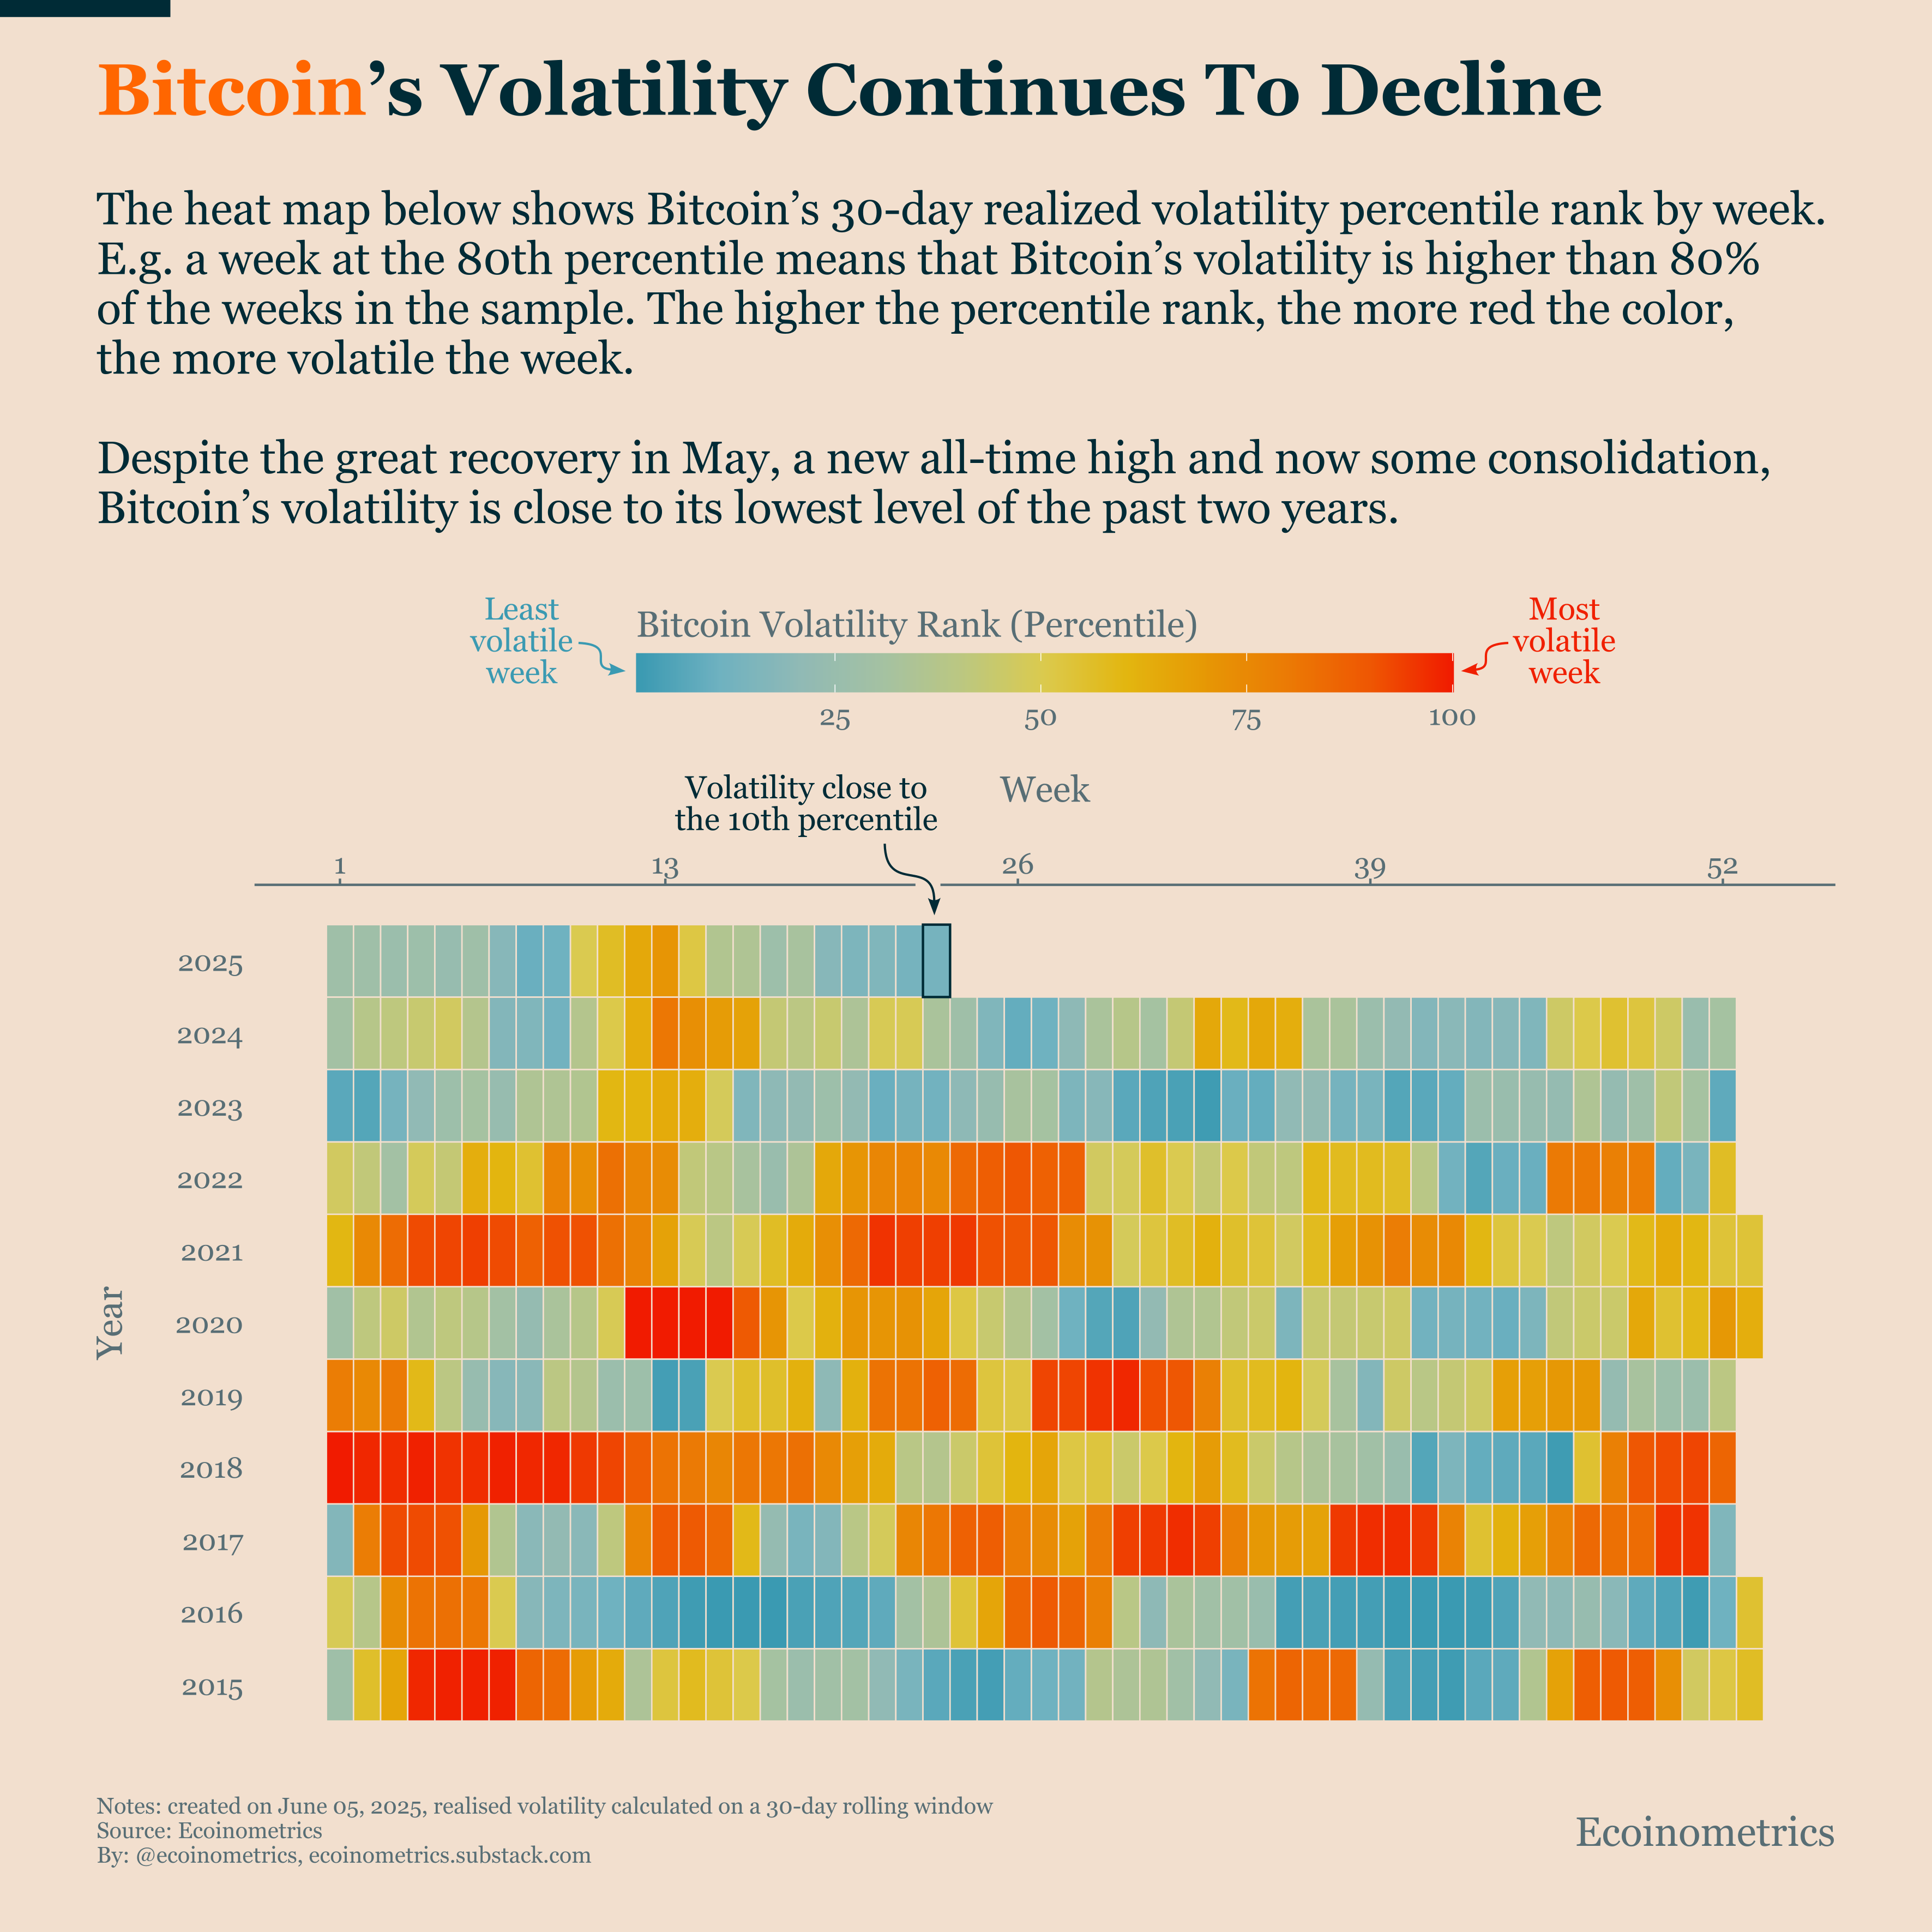
At the moment, there are signs of structural evolution. Despite BTC hitting new all-time highs and rallying strongly in May 2025, the 30-day realized volatility has continued to compress, currently sitting in the 10th percentile of the past decade.
Ecoinometrics noted that this points to a regime shift: Bitcoin may be maturing into an asset capable of delivering returns with less turbulence, an appealing trait for institutional allocators managing volatility exposure.
If this new volatility regime holds, it’s possible that BVIV may remain subdued longer than in past cycles, delaying a sharp volatility-driven price surge. That said, past behavior around these levels has skewed bullish, and investors could be keeping a close watch on any deviation.
Related: Strategy skipped Bitcoin buys last week amid new equity offering
Short-term Bitcoin holders show calm conviction
Onchain data shows that short-term holder (STH) behavior continues to signal confidence. The STH realized cap drawdown is currently at -8%, indicating that newer market participants are sitting on manageable paper losses. Historically, this zone has served as a launchpad rather than a breaking point, signaling limited panic and low forced selling.
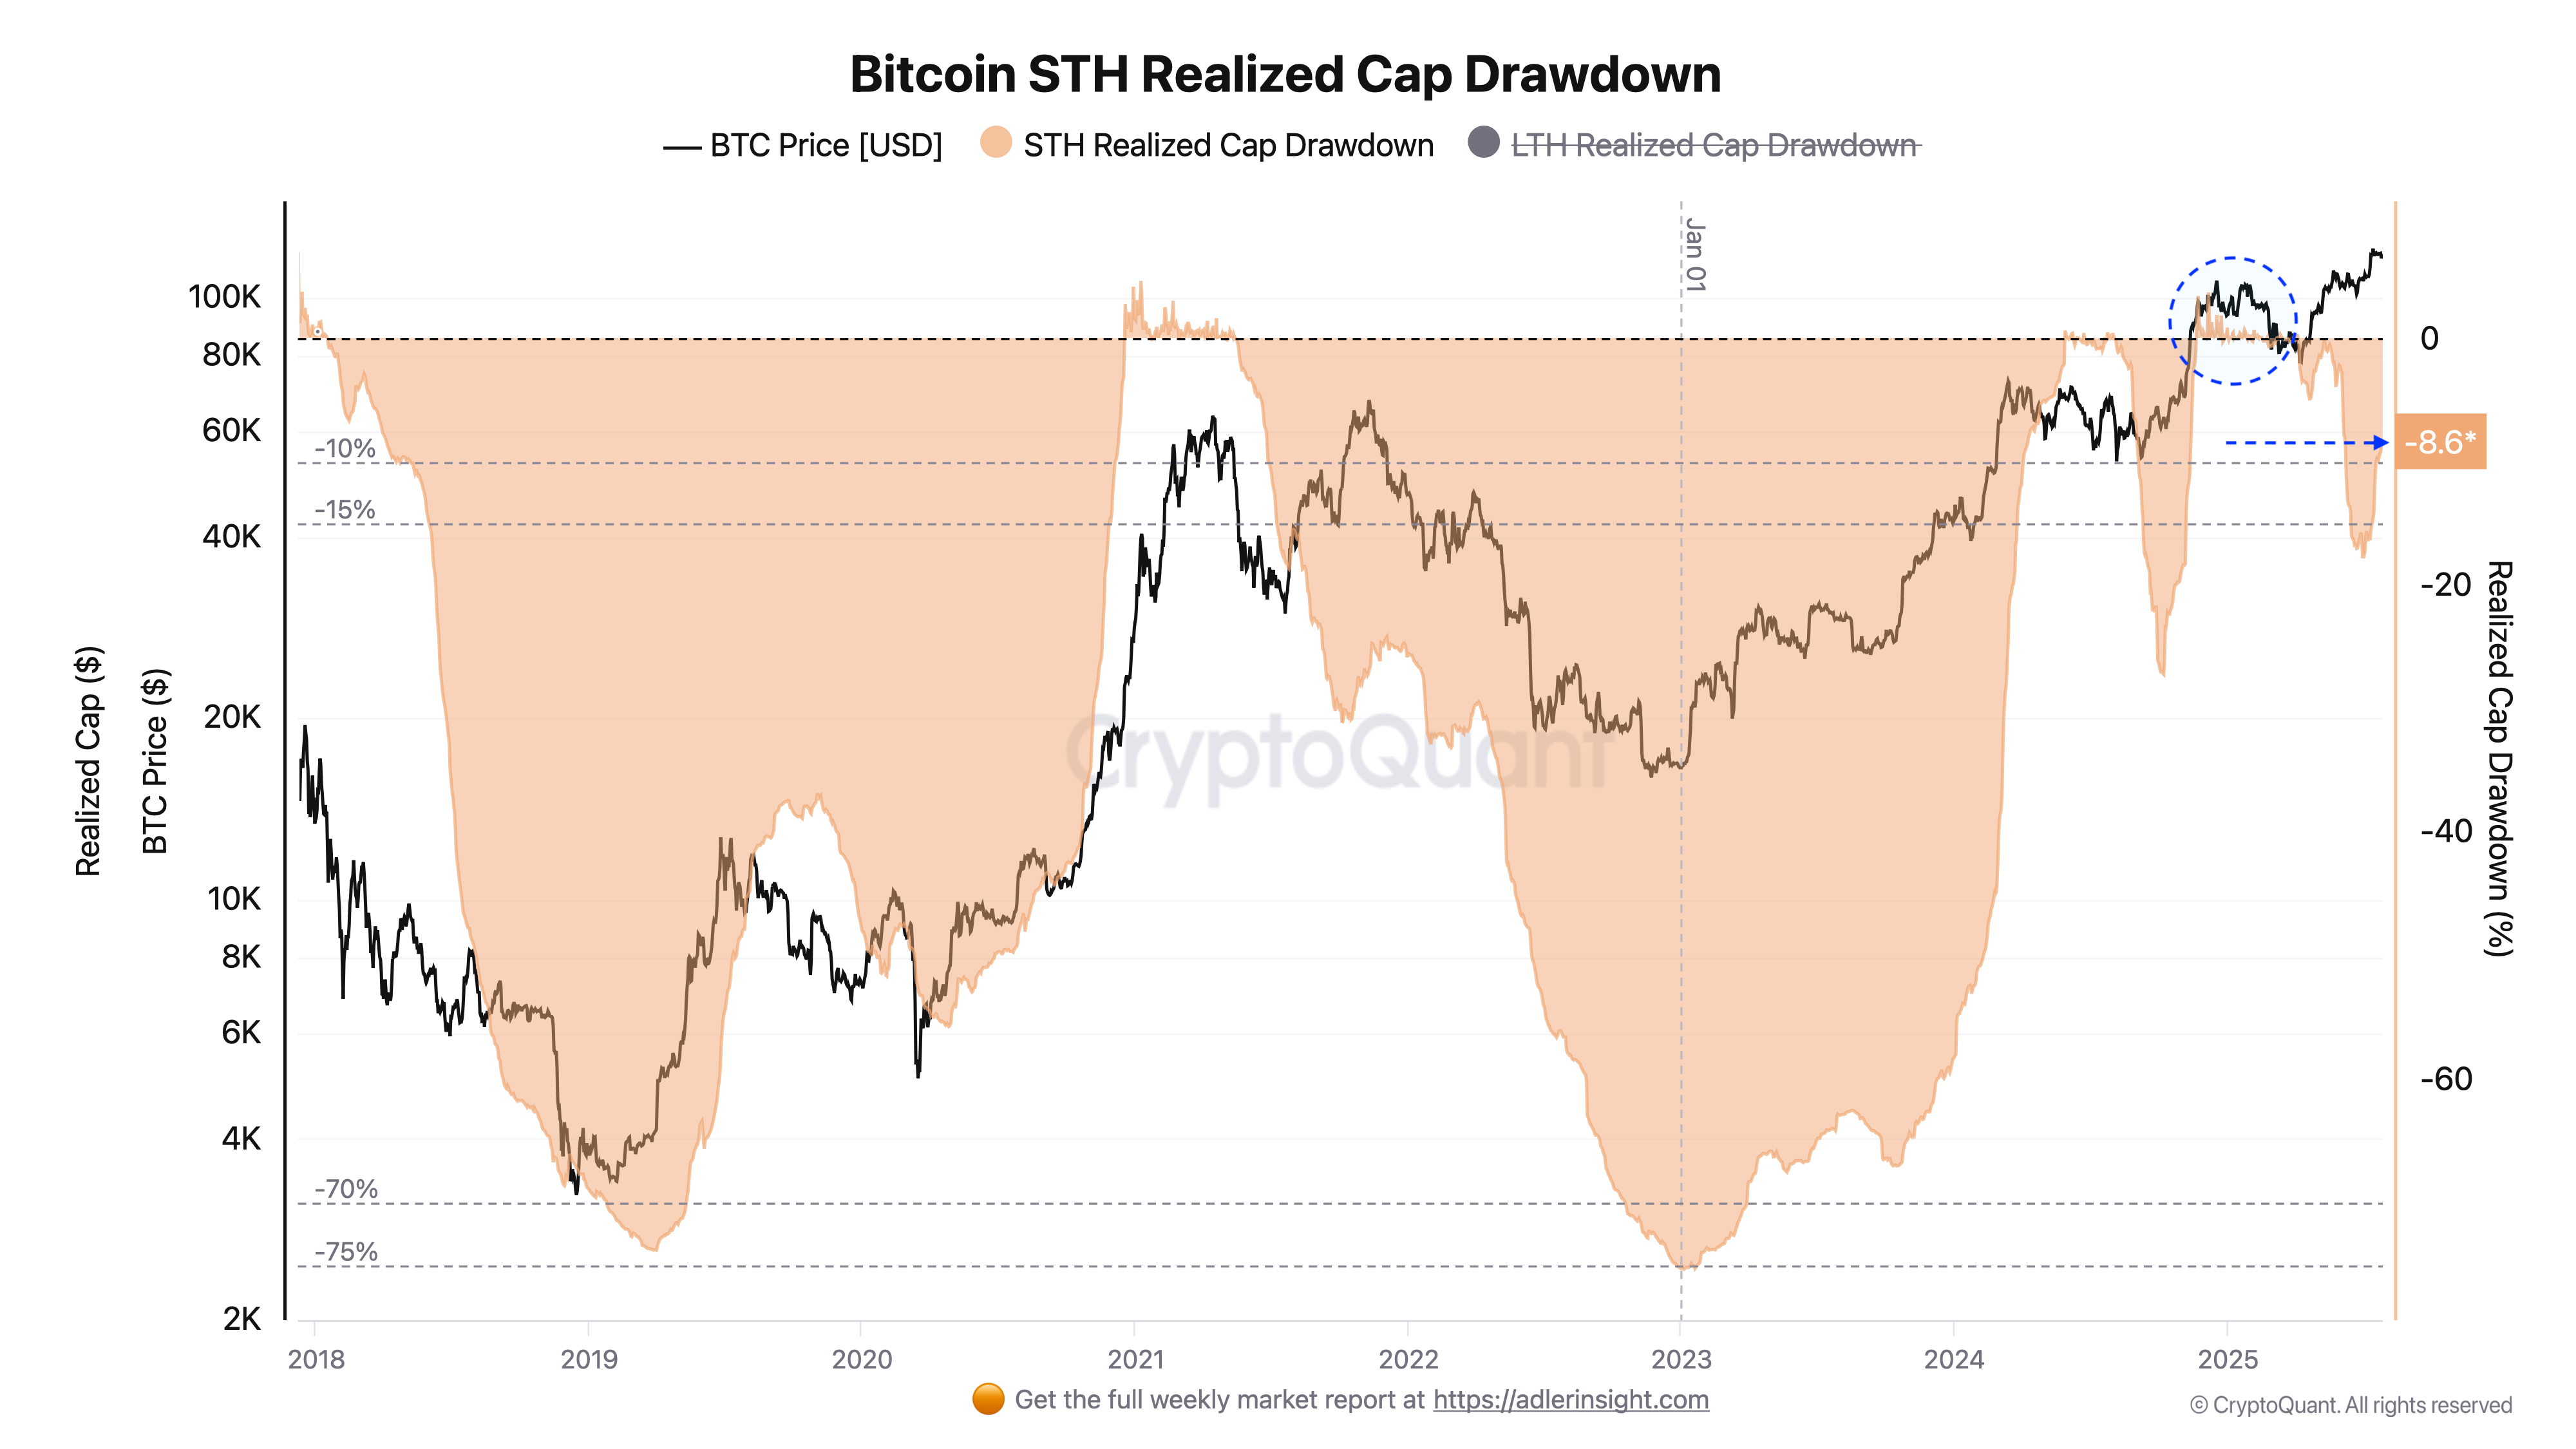
The STH market value to realized value (MVRV) ratio also supports this view, currently at 1.19 compared to the cycle high of 1.33 in November 2024. This shows a drop in speculative risk-taking, with holders choosing to sit tight rather than exit on small gains.
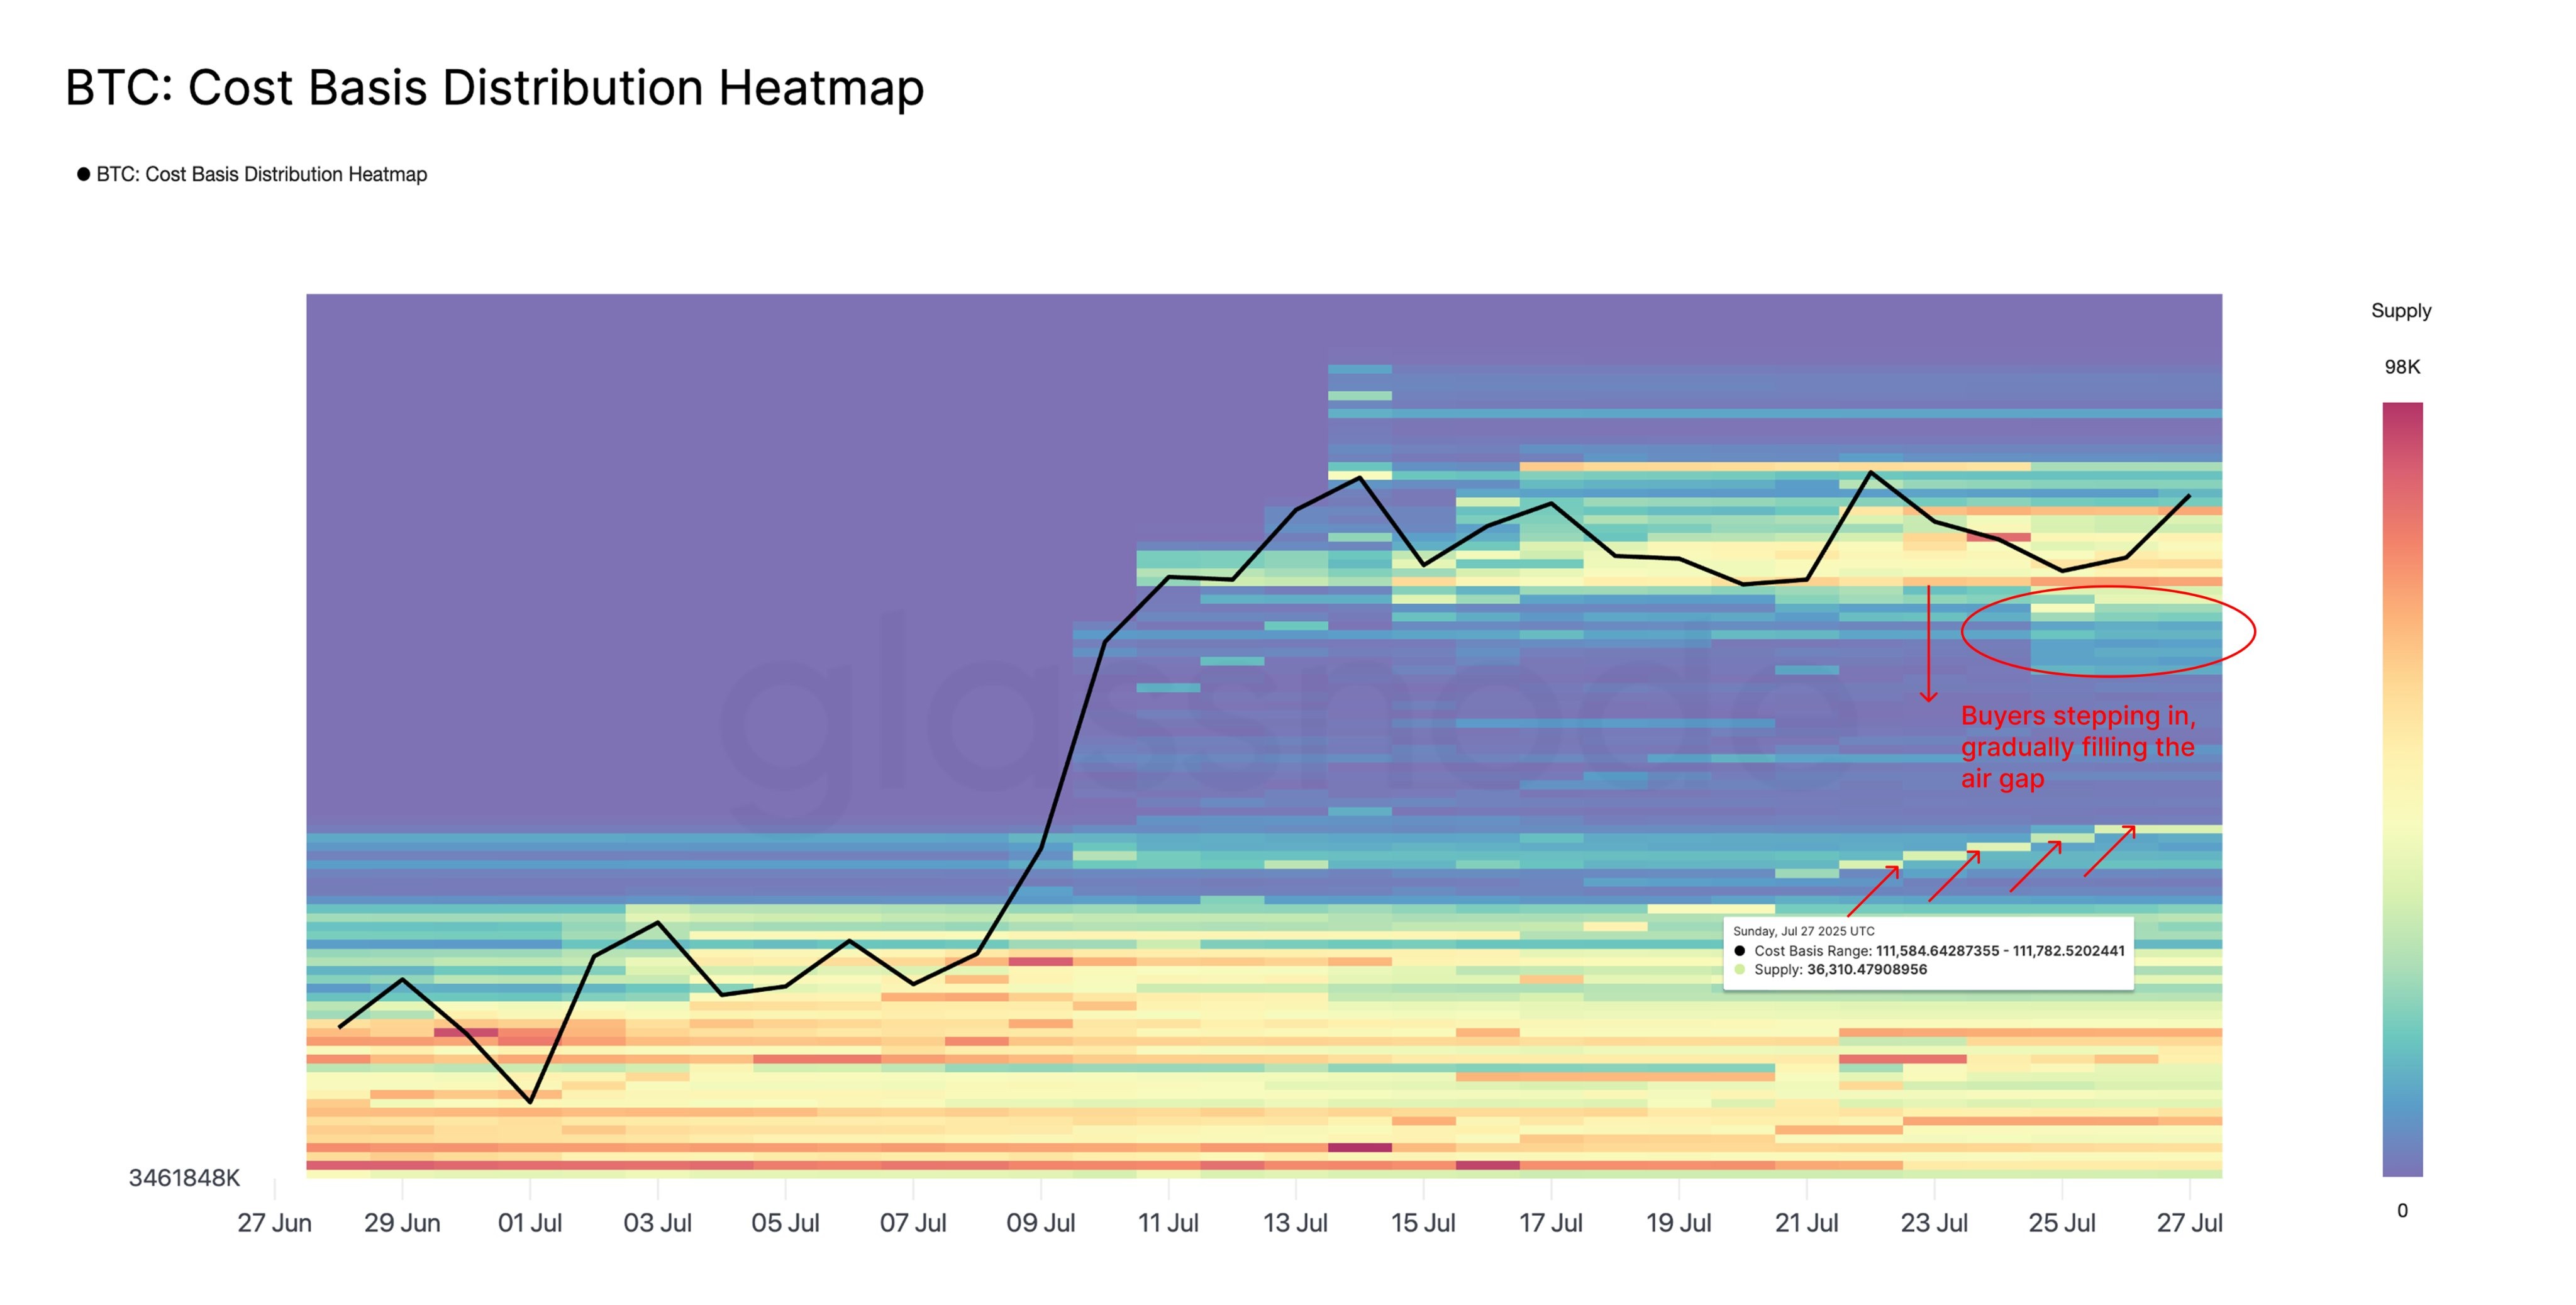
Likewise, Glassnode data also noted that the $110,000–$117,000 range is gradually filling in. BTC is getting accumulated on both higher and lower sides of the spectrum, with buyers stepping in on dips, while early investors remain comfortable acquiring at higher levels. This has created a staircase-like cost basis distribution, a bullish structural pattern suggesting organized accumulation rather than emotional trading.
STH supply reflects a rise to 4.58 million from 4.36 million BTC, adding 227,000 BTC into active circulation. This suggests new demand continues to enter the market, or long-term holders are rotating part of their holdings.
Related: ‘Biggest trade deal ever' — 5 things to know in Bitcoin this week
This article does not contain investment advice or recommendations. Every investment and trading move involves risk, and readers should conduct their own research when making a decision.


