

There is notable disagreement among academics about how investment time horizon should affect portfolio allocations. In recent research released through CFA Institute Research Foundation, we explored this topic at length.
We find that the assumption that returns are independent over time is inconsistent with historical evidence, both domestically and internationally across stocks, bonds, and alternatives.
These findings suggest that investment professionals may need to re-think their portfolio optimization routines — including mean variance optimization (MVO) — which typically assume returns are random across time.
This article is the first in a series of three. Here, we will provide context about how returns historically have evolved over time. In subsequent articles, we will describe what this means for equity portfolios and portfolios of real assets like commodities.
Risk and Investment Horizon
One commonly held belief among many investors and financial advisors is that the risk of certain asset classes, in particular equities, declines over longer investment periods, an effect commonly dubbed “time diversification.”
Evidence provided to support this hypothesis is how the distribution of compounded returns tends to converge for longer investment horizons, as demonstrated in Exhibit 1, which is based on the returns of US equities from 1872 to 2023.
Exhibit 1. The Distribution of Compounded Equity Returns by Investment Horizon 1872 to 2023.
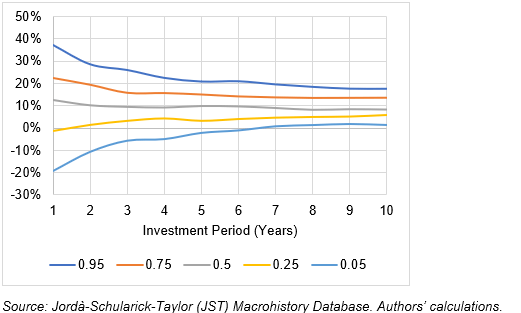
A key problem with this perspective is that investors should not focus on compounded returns. Rather, they should focus on compounded wealth. And compounded wealth tells a different story.
Using the same returns over the same period, Exhibit 2 includes how the distribution of wealth changes by investment horizon and there is clear evidence that it is diverging, not converging.
Exhibit 2. The Distribution of Compounded Wealth by Investment Horizon for an Equity Investor 1872 to 2023.
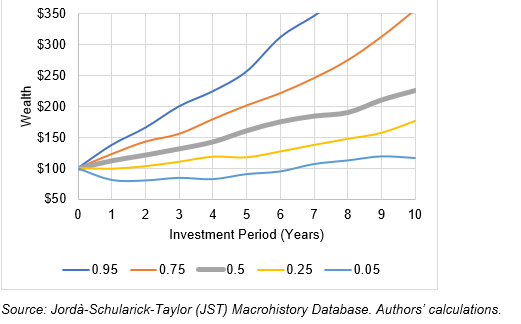
In reality, the risk of virtually all investments increases over time, when risk is defined as the increased dispersion in wealth. This perspective is consistent with options pricing models. While the risk of all investments is increasing, it is important to note that the rate of the increase could vary over time and this variance has important implications for investors with longer holding periods.
If the relative risks of investments change by investment horizon, that would suggest some type of serial dependence is present, which means the returns evolve in a way that isn’t completely random.
Previous research suggests that the return on an investment such as stocks is relatively random. This theory is perhaps best exemplified in Burton Malkiel’s book, A Random Walk Down Wall Street. But our research finds that autocorrelation exists.
In our paper, “Investment Horizon, Serial Correlation, and Better (Retirement) Portfolios,” we provide context around autocorrelation, or how past returns are related to future returns. We examine five US return series — bills, bonds, stocks, commodities, and inflation — using historical annual returns from 1872 to 2023, leveraging data from the Jordà-Schularick-Taylor (JST) dataset and the Bank of Canada.
Exhibit 3 includes the coefficients from a series of ordinary least squares (OLS) regressions, where the dependent variable is the actual return for that calendar year, while the returns for the previous five calendar years are included as independent variables.
Historical returns for each asset class are re-centered, so they have an average return of zero and a standard deviation of one, to reduce any implications associated with historical differences in returns and risk levels. In other words, the regression is effectively based on the z-values of the historical time series returns.
Negative coefficients are highlighted in blue, since this implies the risk of the asset declines over time because a positive return would be more likely to be followed by a negative return. Positive coefficients that are statistically significant, implying that the risk of the asset increases over time, are highlighted in red.
Exhibit 3. Regression Coefficients for an Ordinary Least Squares (OLS) Regression, Where the Dependent Variable is the Current Calendar Year for the Asset Class 1872 to 2023.
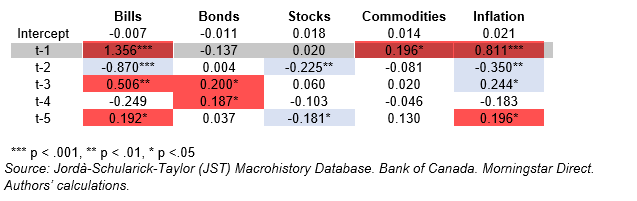
Back to Exhibit 1, there are several coefficients that are statistically significant, defined as a p value less than 0.05, which suggests the historical returns series is not truly independent across time.
Certain asset classes, such as bonds, have exhibited positive autocorrelation historically, while other asset classes, such as equities, have exhibited negative autocorrelation. This suggests that the longer-term risks of owning either asset could change due to the investment horizon. The relative risk of owning equities should decline compared to bonds, for example.

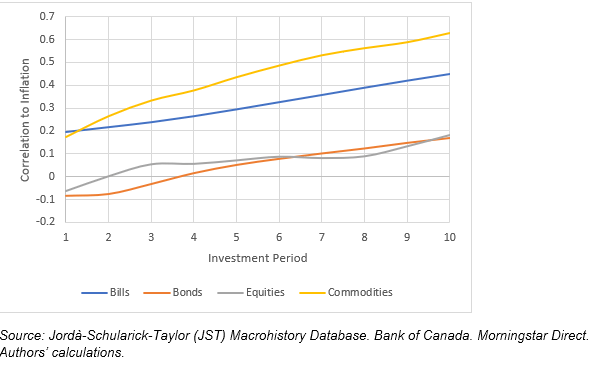
Next, we look at how the risk of assets can change when considering inflation. For this analysis, we estimate the correlation between the cumulative growth in wealth and cumulative impact of inflation for different investment horizons for the same four asset classes.
Inflation is often explicitly considered in certain types of optimizations (e.g., a “surplus” or liability-relative optimization). One potential issue when considering inflation, however, is that changes in the prices of goods or services do not necessarily move in sync with the changes in the financial markets. In other words, there could be lagged effects.
For example, while financial markets can experience sudden changes in value, inflation tends to take on more of a latent effect, where changes can be delayed and take years to manifest. Focusing on the correlation — or covariance — of inflation with a given asset class like equities over one-year periods may hide potential longer-term effects.
The correlations of the four asset classes vary notably with inflation by different investment horizons. For example, a one-year investment horizon, which is a common time frame used for MVO assumptions, the correlations are relatively low for all asset classes, suggesting little potential hedging benefit.
However, there are notable increases over a 10-year period that can at least be partially explained by positive drift for each asset. The correlation between commodities and inflation increases to 0.62, for example.
The notable increase in correlations for bills and commodities is especially salient because the returns for bills and commodities are notably lower over the historical period. We will discuss this in a future article. This suggests the effect is not simply due to higher historical returns, but rather the differences in how the asset classes have responded to inflation over time.
The results suggest there is some level of serial dependence among the asset classes considered, which could potentially impact optimal portfolio allocations over longer periods (e.g., 10+ years). We explore this effect further, looking at how the standard deviation of wealth has changed for the respective asset classes across different investment horizons using sequential historical returns from 1872 to 2023.
The actual historical standard deviations are compared to the deviations from a bootstrap simulation where the historical returns for the respective asset classes are randomly recombined, or bootstrapped.
Bootstrapping is useful because it preserves the potentially interesting features of time series data. These features keep the means and covariances constant, but they change the sequence of the actual historical returns, making them random.
Bootstrapping would capture things like skewness and kurtosis, so that the differences in the wealth distributions would largely be due to some type of serial dependence (e.g., the autocorrelations noted previously).
The first year’s annual standard deviation is adjusted based on the ratio of the future standard deviation of terminal wealth values to the bootstrap value for investment periods up to 10 years. If no type of serial dependence in historical returns (e.g., autocorrelation) existed, the lines in Exhibit 4 would be flat, while a declining line would suggest negative autocorrelation and a rising line would suggest positive autocorrelation.
Exhibit 5. Standard Deviation for Bills, Bonds, Equities, and Commodities for Various Investment Periods 1872 to 2023.
Nominal Returns Real Returns
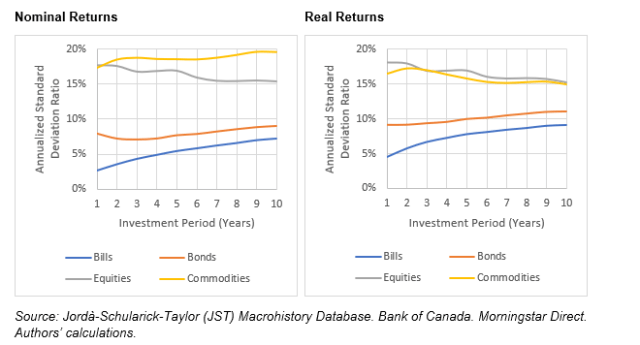
This analysis provides evidence that the risk of assets can vary by investment period, especially when considering inflation. For example, in nominal terms, the standard deviation of wealth of equities decreases over longer investment periods, while the standard deviation of bills, bonds, and commodities increases.
However, when considering inflation (Panel B, Exhibit 5), the standard deviation of commodities decreases roughly at the same rate as equities. This is a notable shift and suggests the perceived efficiency of commodities is likely to vary dramatically regardless of whether inflation is considered. We will demonstrate this in a future article.
In our paper, we extend the analysis further to explore international markets and include the results in Appendix 2. The international results are similar to the US results: the distribution of wealth tends to decline relative to the bootstrapped values for equities, while it tends to rise for bonds and bills. This is important because it suggests these effects are simply not a US phenomenon.
Overall, there is notable evidence that asset classes like bills, bonds, equities, and commodities exhibit varying levels of serial dependence. This suggests a portfolio’s optimal allocation could change by investment horizon, which is what we will explore in our next article in this series.
If you liked this post, don’t forget to subscribe to Enterprising Investor.
All posts are the opinion of the author. As such, they should not be construed as investment advice, nor do the opinions expressed necessarily reflect the views of CFA Institute or the author’s employer.
Image courtesy of Nick Webb. This file is licensed under the Creative Commons Attribution 2.0 Generic license. Cropped.
Professional Learning for CFA Institute Members
CFA Institute members are empowered to self-determine and self-report professional learning (PL) credits earned, including content on Enterprising Investor. Members can record credits easily using their online PL tracker.


