

Passive environmental, social, and governance (ESG) investing has become increasingly active. It’s time for a rethink.
Assets have poured into passive ESG indexes in recent years. As more investors look to align sustainability goals with their investments, global ESG assets under management (AUM) have soared from $2.2 trillion in 2015 to $18.4 trillion in 2021.
Yet ESG assets aren’t all that’s on the rise. With ever-changing methodologies and expanding exclusion lists, the active risk of popular ESG indexes is also climbing. This begs the question: Does the term “passive” even apply to ESG investing?
Given the lack of consensus on sustainability criteria and the evolving data sets and exclusions, the answer is no. ESG investing is inherently active and investors should evaluate ESG strategies accordingly. That means focusing on the drivers of risk and return.
But just what is propelling the rise in index tracking errors and how can investment managers integrate factors and deliver risk-efficient portfolios with proven sources of return that aren’t found in “passive” offerings?
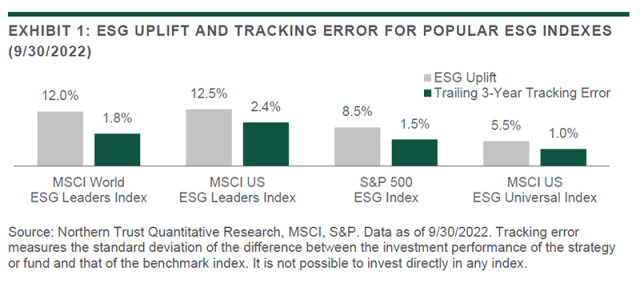
Passive indexes are popular because they track broad market benchmarks at low cost. With similar inclusion criteria and construction methodologies, such capitalization-weighted indexes share common features and are built around a broad consensus. Passive ESG indexes do not exhibit the same characteristics. Indeed, four popular ESG indexes display vastly different levels of ESG uplift and tracking error, as Exhibit 1 demonstrates.
While the drivers of active risk vary among indexes, most are sourced from idiosyncratic risk. Exhibit 2, which lists the top five overweights and underweights of each index, illustrates this.
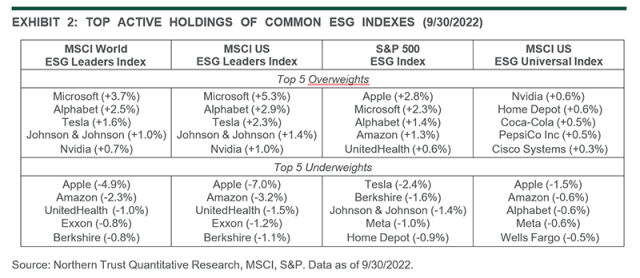
The MSCI US ESG Leaders Index has a 5.3% overweight to Microsoft and -7.0% underweight to Apple. Such active weights resemble traditional active management more than passive investing.
Similar divergence even occurs within the same index family. The MSCI US ESG Leaders and MSCI US ESG Universal indexes, for example, share only Nvidia among their top five overweights. Alphabet, with combined Class A and Class C shares, meanwhile, comprises the second largest overweight in Leaders and the third largest underweight in Universal even though the indexes use the same ESG ratings.
The differences are even more dramatic across index providers. Three of the top five overweights in the S&P 500 ESG Index are among the top five underweights in the MSCI US ESG Leaders Index. Two of the latter’s top holdings — Tesla and Johnson & Johnson — are underweights in the former. Apple is the most extreme example, with an absolute difference between the two indexes of nearly 10% — -7.0% vs. +2.8%. By comparison, Apple’s weight in the cap-weighted MSCI US and S&P 500 indexes differs by fewer than 10 basis points (bps) over the last five years. No wonder the MSCI US ESG Leaders and S&P 500 ESG indexes have a 2.5% relative tracking error, three times more than their cap-weighted counterparts.
The lack of overlap among ESG indexes and the wide dispersion in risk levels means that investors must be diligent in aligning their ESG objectives with their chosen strategy. They must also ensure that the level of ESG is commensurate with the active risk taken. And they have to remember that the evolving ESG landscape requires constant oversight.

Less ESG for More Risk?
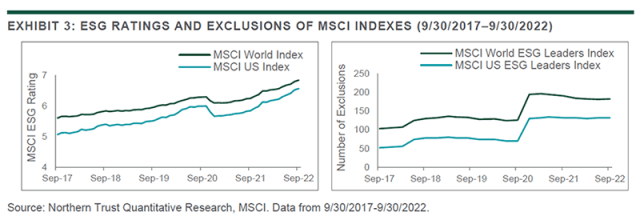
While higher ESG content has always necessitated higher active risk, recent trends have exacerbated this trade-off. Exhibit 3 plots the aggregate cap-weighted ESG ratings of the MSCI World and MSCI US indexes along with the number of exclusions for the MSCI World ESG and US ESG Leaders indexes. The broad-based ESG rating improvements over the past five years suggest that companies are addressing their ESG risks.
But over this same time period, more and more companies are being excluded from ESG indexes. These trends are difficult to reconcile, as higher aggregate ESG ratings ought to lead to fewer exclusions not more. In practice, the exclusions have proven easy to add yet difficult to remove.
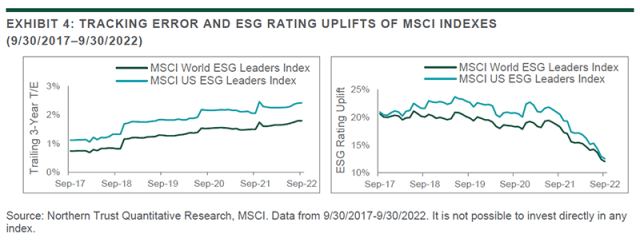
These changes, along with numerous methodology revisions, have increased “passive” ESG index tracking error levels over the past five years. Exhibit 4 demonstrates the increasingly active nature of these passive ESG benchmarks. While the COVID-19 crisis is a factor in this development, it does not fully account for the rise in tracking error. Tracking error jumped in late 2018, well before the onset of pandemic-related market turmoil in 2020. The ESG rating uplifts also declined in response to the higher ratings of the underlying indexes, as shown in Exhibit 3.
What it all adds up to is more concentrated portfolios with lower ESG uplifts and more active risk. The irony of course is that the integration of ESG data is often promoted as a way to decrease portfolio risk.
The key to capturing ESG benefits, and capturing them efficiently, lies in modern portfolio construction techniques.

Improving ESG Efficiency
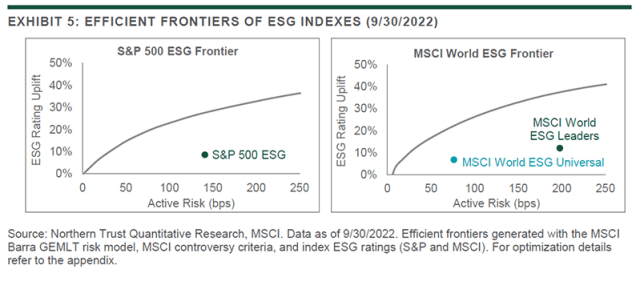
How can we improve a portfolio’s efficiency when integrating ESG content? First, we need to establish a baseline. In Exhibit 5, we plot the achievable active risk levels at varying degrees of ESG uplift based on each index provider’s unique ESG ratings and after excluding those companies flagged by MSCI controversy criteria. As we can see within the chart, each ESG index falls well outside of what would be considered efficient.
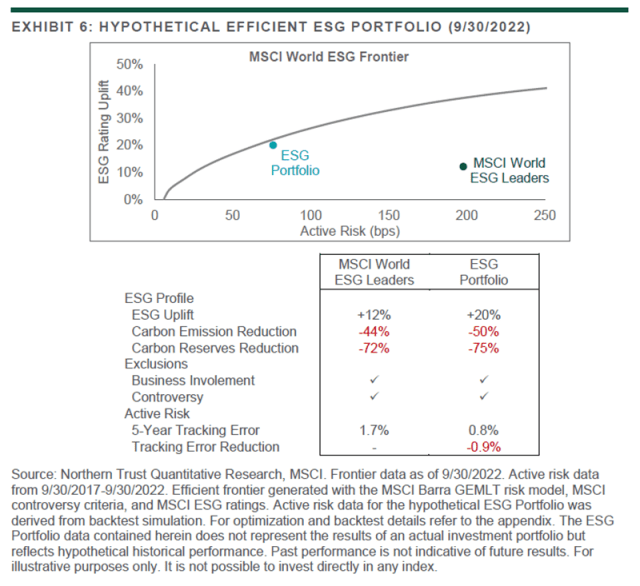
The distance of each index from the efficient frontier is a product of two developments: additional business involvement exclusions and suboptimal portfolio construction. To quantify the effect of each, we plotted a hypothetical ESG portfolio within the MSCI World ESG frontier in Exhibit 6. The ESG Portfolio excludes the same set of companies as the MSCI World ESG Leaders Index, while targeting a higher (20%) ESG rating uplift and similar levels of carbon reduction.
Given the distance of the ESG Portfolio from the efficient frontier, we see that multiple ESG objectives can be achieved with a minimal increase in active risk. The ESG Portfolio has less than half the active risk of the MSCI World ESG Leaders Index. We attribute that 76 bps vs. 198 bps divergence to portfolio construction. Although the X-axis of the efficient frontier represents predicted risk, the five-year backtest simulation yields a reduction in tracking error greater than 50% for the hypothetical ESG Portfolio compared to the MSCI World ESG Leaders Index.
Achieving higher levels of ESG content with less active risk than passive ESG indexes might tempt some to declare victory. However, ESG’s constantly evolving nature means the higher tracking error may become unavoidable even with the help of portfolio optimizers. While some believe higher ESG content leads to higher returns, such relationships are difficult to prove empirically. Indeed, excess return objectives are conspicuously absent from the prospectus of most passive ESG indexes. The lack of consensus highlighted in Exhibit 2 also suggests the investment industry is not totally convinced of the ESG investment thesis. For investors concerned with the return potential of their equity portfolio, allocating some active risk to proven drivers of return is a prudent move.
So how can we integrate ESG content with style factors and build a portfolio with the potential for excess return and lower risk?

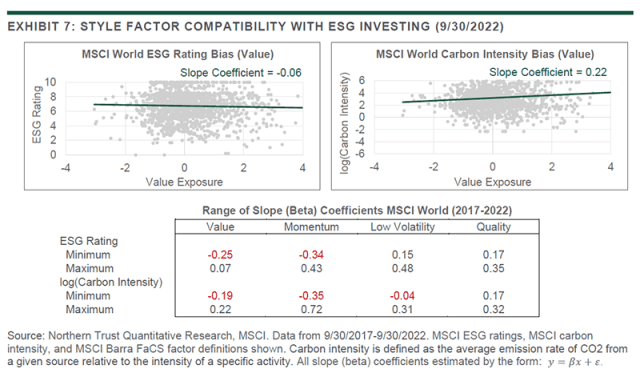
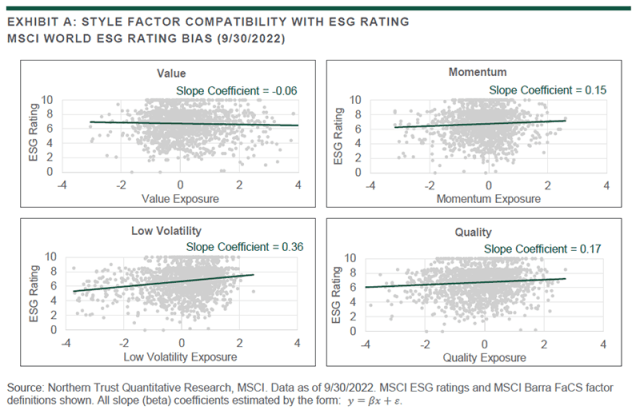
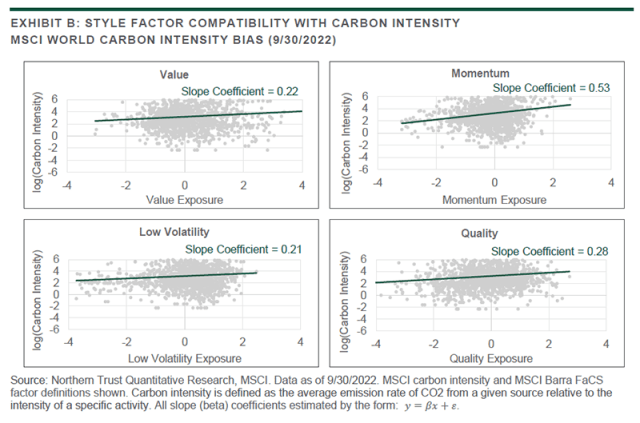
To meet the ESG and excess return objectives, we analyzed the relationship between style factors and ESG at the security level. Exhibit 7 plots pairwise observations between value and two common ESG characteristics — ratings (MSCI ESG score) and carbon intensity. The scatter plots show significant dispersion and mild trendlines, indicating that the value factor exhibits no strong bias to either ESG dimension. While value is highlighted for the purpose of illustration, the range of slope coefficients over the past five years for value, momentum, low volatility, and quality are reported in the accompanying table (See Exhibits A and B in the appendix for corresponding scatter plots).
Collectively, the data shows no evidence of persistent problematic bias. This indicates style factors can be integrated with ESG objectives to enhance the investment thesis with relative ease.
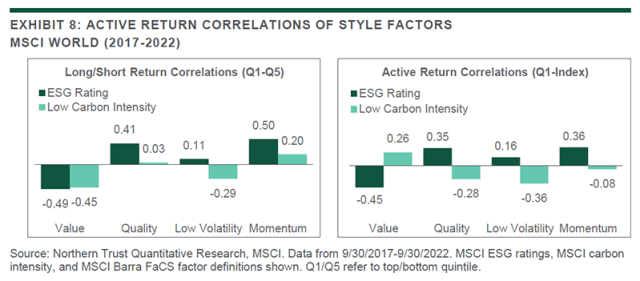
Having evaluated style factors and ESG in the cross section, we next analyze the relationship from a returns perspective. Exhibit 8 charts long/short and active return correlations over the past five years. All correlations are within +/-0.5, implying that style factors have attractive diversification potential for ESG investors. These results are consistent with previous studies.
Finally, based on the analysis in Exhibit 6, we constructed a hypothetical portfolio that incorporates significant multi-factor content. The ESG + Factor Portfolio displayed in Exhibit 9 contains balanced, material exposure to value, momentum, low volatility, and quality while preserving the ESG profile of the ESG Portfolio.
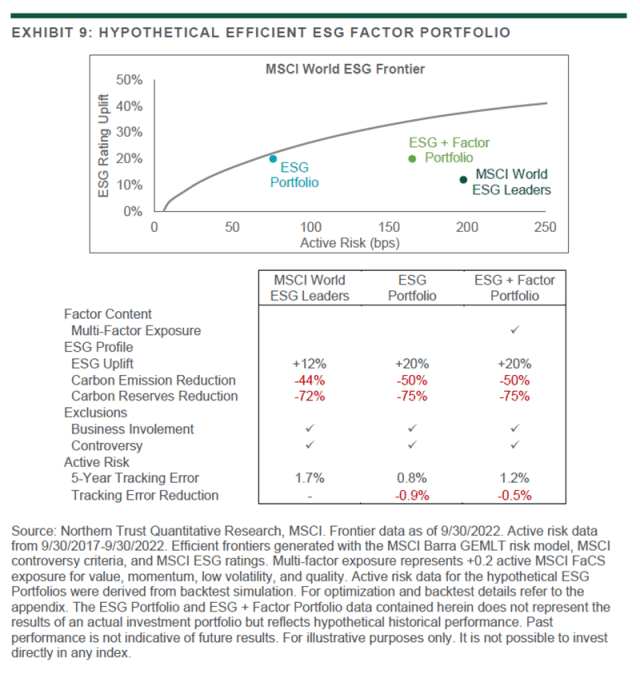
While passive alternatives are often thought to have less risk than an actively managed multi-factor ESG strategy, the ESG + Factor Portfolio demonstrates that meeting a robust set of ESG objectives, with less risk, while incorporating proven sources of excess return that aren’t included in passive ESG indexes, is possible.

What’s Next?
The integration of ESG data requires investors to make active decisions, including which ratings provider to use, what types of businesses to exclude, how to effectively mitigate carbon risk, etc. These decisions must be revisited frequently as the data improves, new frameworks are put forth, and as investor preferences change. These dynamics point to the inherently active nature of ESG investing, despite the (quite successful) attempts to paint them with a passive brush.
While better data and forward-looking materiality frameworks have delivered new tools for more informed portfolio construction, whether they improve portfolio performance has yet to be proven. Investors should therefore approach ESG strategies by asking the same question they would of any actively managed strategy, namely: What are the drivers of return? A satisfactory answer to this question will deliver a solution that stands on its own merits among peers, not one simply categorized under an “ESG” subheading.
Appendix
Methodology Notes
Efficient Frontier Optimizations Objective function
Subject to the following constraints
- Companies flagged with controversy criteria as defined by MSCI are ineligible
- Minimum ESG uplift (specified for each point along the frontier)1
Hypothetical Efficient ESG Portfolio Optimizations Objective function
Subject to the following constraints
- Companies flagged with controversy criteria as defined by MSCI are ineligible
- Minimum 20% ESG uplift1
- Minimum 50% carbon emissions reduction1,2
- Minimum 75% carbon reserves reduction1,2
- Companies flagged with business involvement criteria as defined by the MSCI World ESG Leaders Index methodology are ineligible3
- Minimum +0.2 active factor exposure for value, momentum, low volatility, and quality1,3
Backtest simulation parameters
- Quarterly rebalance frequency
- Turnover not to exceed 60% annualized
Notes
1. Relative to the underlying benchmark
2. MSCI carbon data used
3. Where denoted as having been applied
If you liked this post, don’t forget to subscribe to the Enterprising Investor.
All posts are the opinion of the author. As such, they should not be construed as investment advice, nor do the opinions expressed necessarily reflect the views of CFA Institute or the author’s employer.
Image credit: ©Getty Images / ollo
Professional Learning for CFA Institute Members
CFA Institute members are empowered to self-determine and self-report professional learning (PL) credits earned, including content on Enterprising Investor. Members can record credits easily using their online PL tracker.


")


