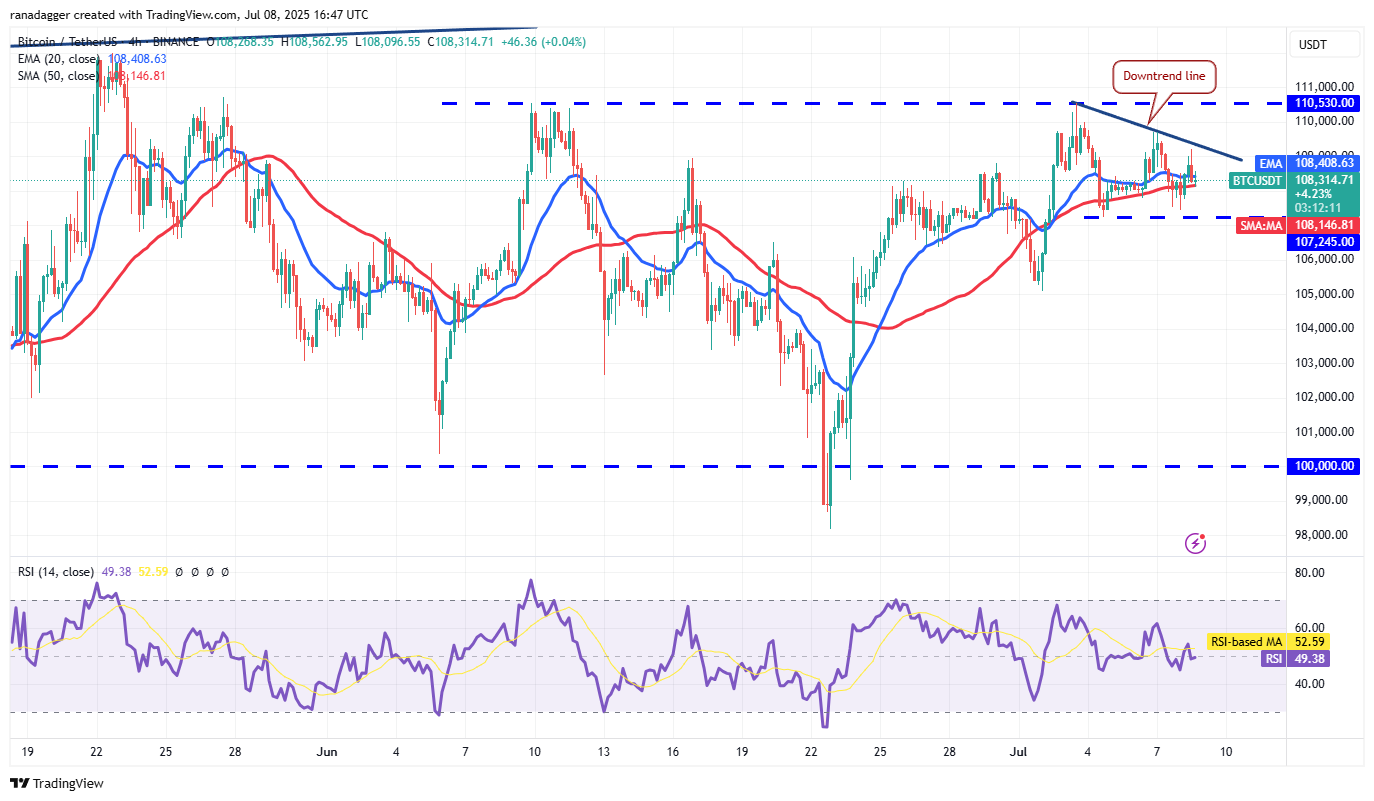
Key point:
-
Bitcoin is finding support at $107,245, showing investor sentiment remains positive, and every minor dip is being purchased.
Bitcoin (BTC) is attempting to bounce off the moving averages, indicating buying on dips. Although the price is just below the all-time high of $111,980, it is not yet in the overvalued zone. CryptoQuant contributor Axel Adler Jr. said in a post on X that the Mayer Multiple at 1.1x was “within the neutral zone (0.8–1.5х).”
Could Bitcoin break out of its all-time high, resuming its uptrend? Let’s analyze the charts to find out.
Bitcoin price prediction
Bitcoin is being squeezed between the 20-day exponential moving average (EMA) ($107,314) and the overhead resistance of $110,530.
The upsloping 20-day EMA and the relative strength index (RSI) in the positive zone signal that the break may happen to the upside. If the $110,530 resistance is scaled, the BTC/USDT pair could challenge the all-time high at $111,980 and later the neckline of the inverse head-and-shoulders pattern.
Sellers are expected to fiercely defend the neckline because a break above it will complete the bullish setup. That opens the doors for a potential rally toward the pattern target of $150,000.
This optimistic view will be invalidated in the near term if the price turns down and breaks below the 50-day simple moving average (SMA) ($106,642). That could tempt short-term buyers to book profits, pulling the pair to $104,500 and then to $100,000.
Related: Bitcoin price gained 72% and 84% the last two times BTC holders did this

The pair is finding support at $107,245, indicating that every minor dip is being purchased. If buyers drive the price above the downtrend line, the developing descending channel pattern will be invalidated. The failure of a bearish pattern increases the possibility of a break above $110,530. If that happens, the pair may climb to $111,980 and subsequently to $113,500.
Instead, the bearish setup will complete if the price turns down and breaks below $107,245. That could sink the pair to the pattern target of $103,960.
This article does not contain investment advice or recommendations. Every investment and trading move involves risk, and readers should conduct their own research when making a decision.


