

Key points:
-
Bitcoin’s recovery remains on track, backed by solid demand from the spot Bitcoin ETF buyers.
-
BNB, HYPE, and SOL are leading the altcoin charge higher, signaling solid buying by the bulls.
Bitcoin (BTC) rose to $116,495 on Friday, and the relief rally is backed by solid buying in the spot BTC exchange-traded funds (ETFs), which witnessed $1.7 billion in net inflows this week, according to data from SoSoValue.
Crypto trader and analyst Matthew Hyland spotted the most extreme level of tightness on the Bollinger Bands on the monthly time frame. Separately, popular analyst Crypto Ceasar said in a post on X that similar tightness previously led to heavy upside volatility and “BTC could be in for a spicy Q4.”
However, not everyone is bullish on BTC in the near term. CryptoQuant analyst JA Maartun said in a post on X that BTC’s momentum was cooling as “8 out of 10 signals in the CryptoQuant Bull Score Index” were flashing bearish for BTC.
What are the crucial support and resistance levels to watch out for in BTC and the major altcoins? Let’s analyze the charts of the top 10 cryptocurrencies to find out.
Bitcoin price prediction
BTC broke above the $113,500 resistance on Wednesday and extended the recovery above the 50-day simple moving average (SMA) ($114,544) on Thursday.
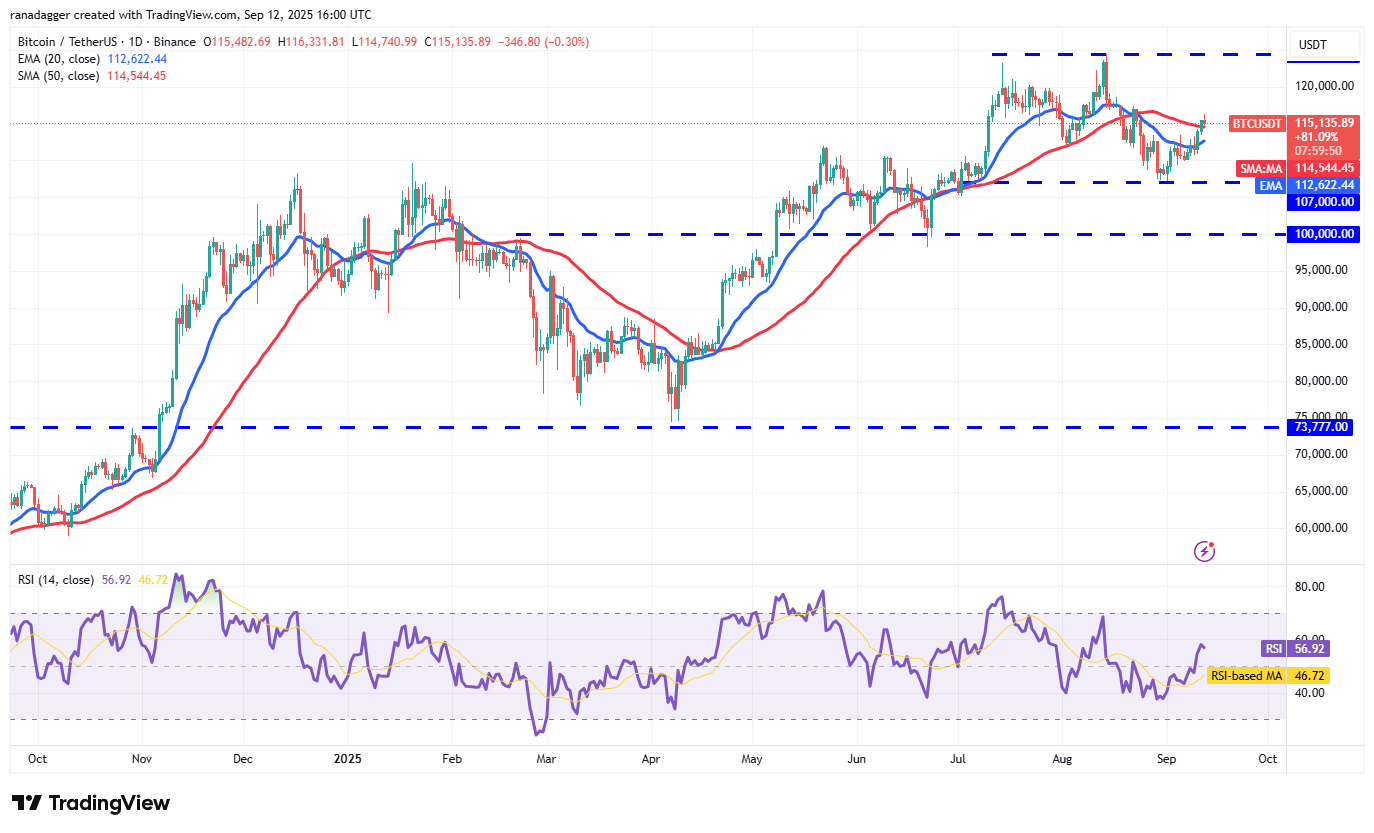
There is resistance at $117,500, but if the buyers overcome it, the BTC/USDT pair could soar to $120,000 and eventually to $124,474. Sellers will try to halt the up move at $124,474 because a break above it could start the next leg of the uptrend to $141,948.
The bears will have to pull the Bitcoin price back below the 20-day exponential moving average (EMA) ($112,622) to weaken the bullish momentum. The pair may then collapse to $107,000, where the buyers are expected to step in.
Ether price prediction
Ether (ETH) narrow range trading resolved to the upside on Friday, indicating that the bulls have overpowered the bears.
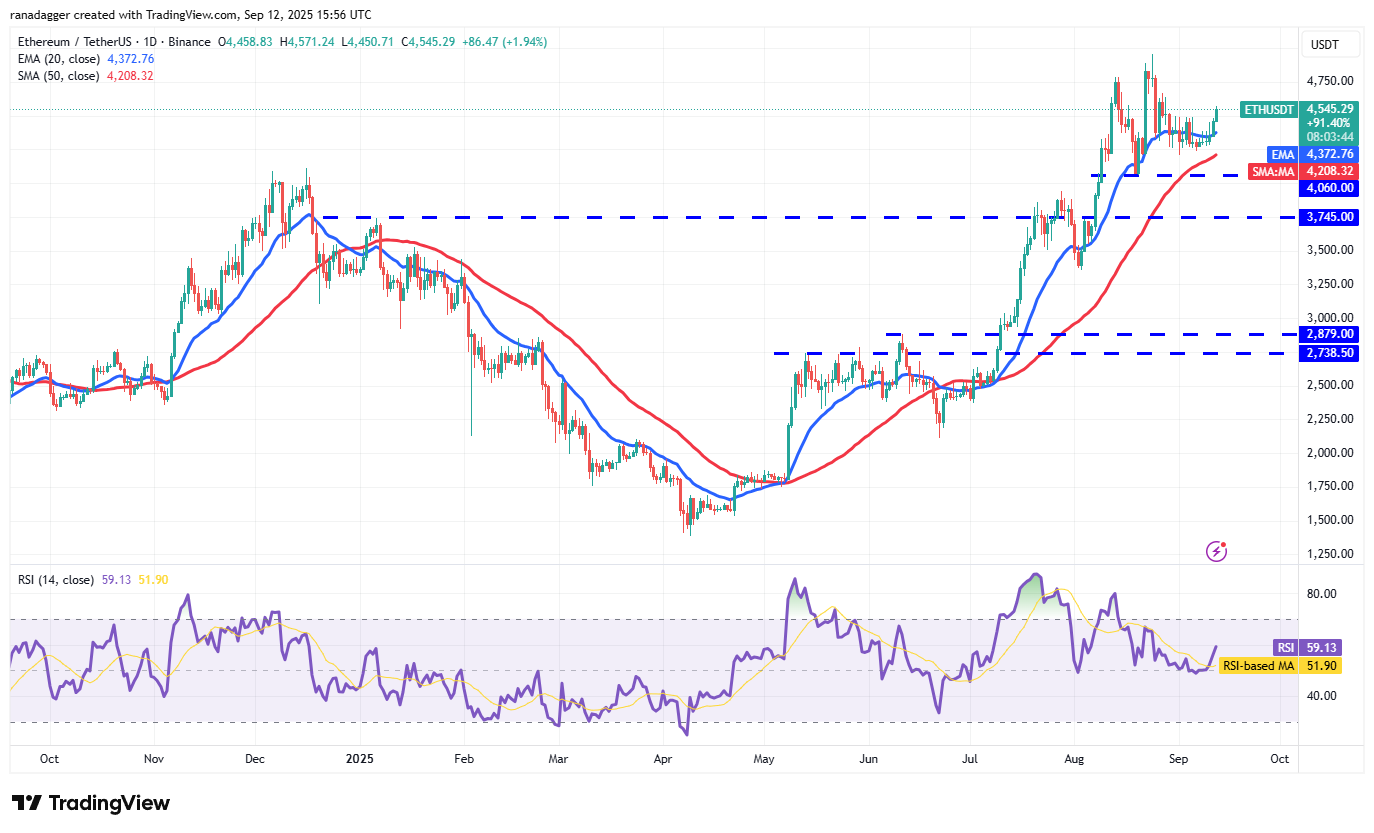
The bulls will try to challenge the $4,957 level, where they are expected to face significant selling from the bears. If the price turns down from $4,957 but rebounds off $4,500, it improves the prospects of an upside breakout. The ETH/USDT pair could then surge toward $5,500.
Conversely, if the pair turns down and breaks below $4,250, it suggests that the bears are selling on every minor rally. The Ether price could then drop to $4,060 and subsequently to $3,500.
XRP price prediction
The bulls pushed XRP (XRP) above the downtrend line on Thursday but are struggling to build on the breakout.
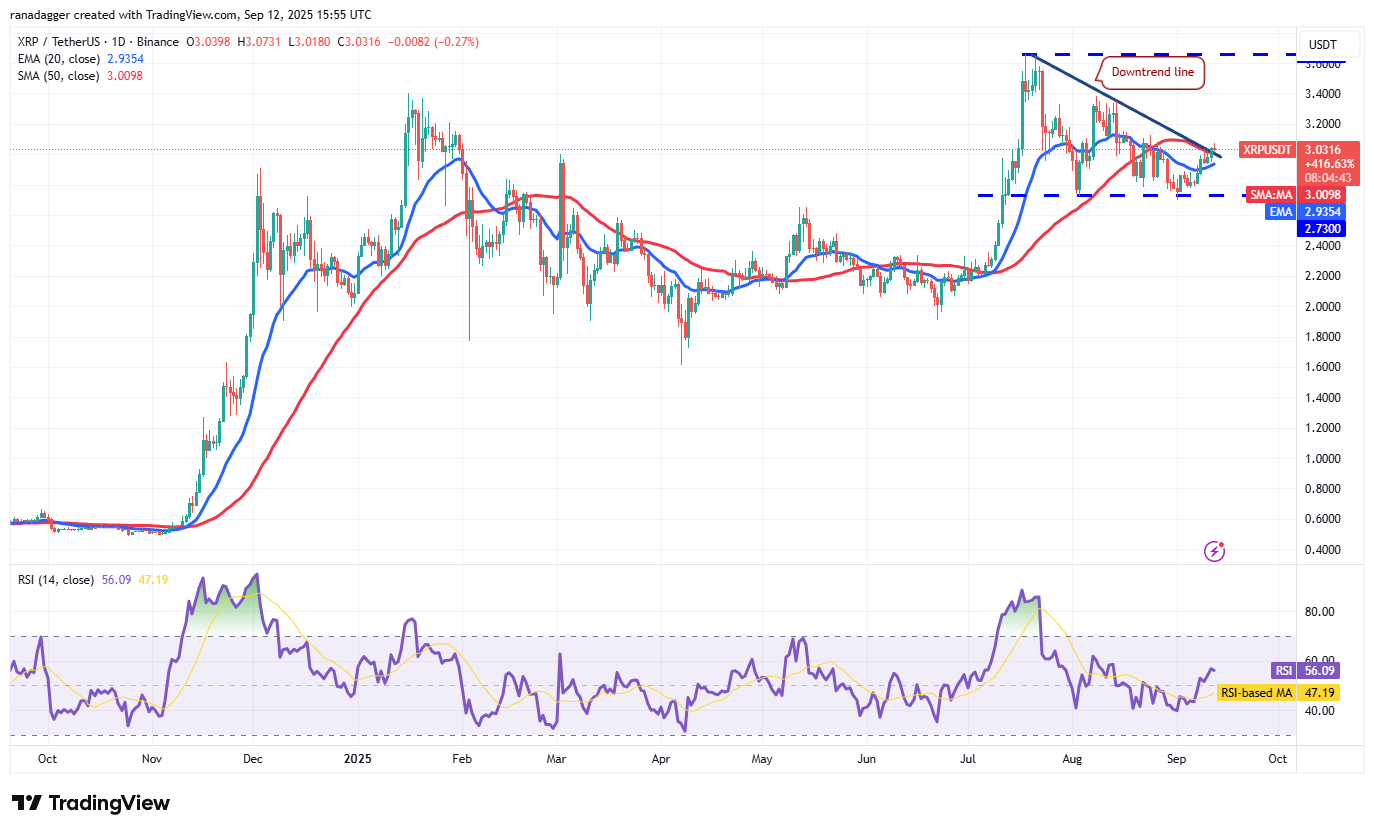
If the price turns down and breaks below the 20-day EMA ($2.93), it suggests the breakout may have been a bull trap. The bears will then try to pull the XRP/USDT pair to the solid support at $2.73.
Instead, if the price turns up from the 20-day EMA and breaks above $3.15, it signals a change in sentiment from selling on rallies to buying on dips. The XRP price could then rally to $3.40.
BNB price prediction
BNB (BNB) hit a new all-time high on Friday, indicating that the bulls are trying to build upon their advantage.
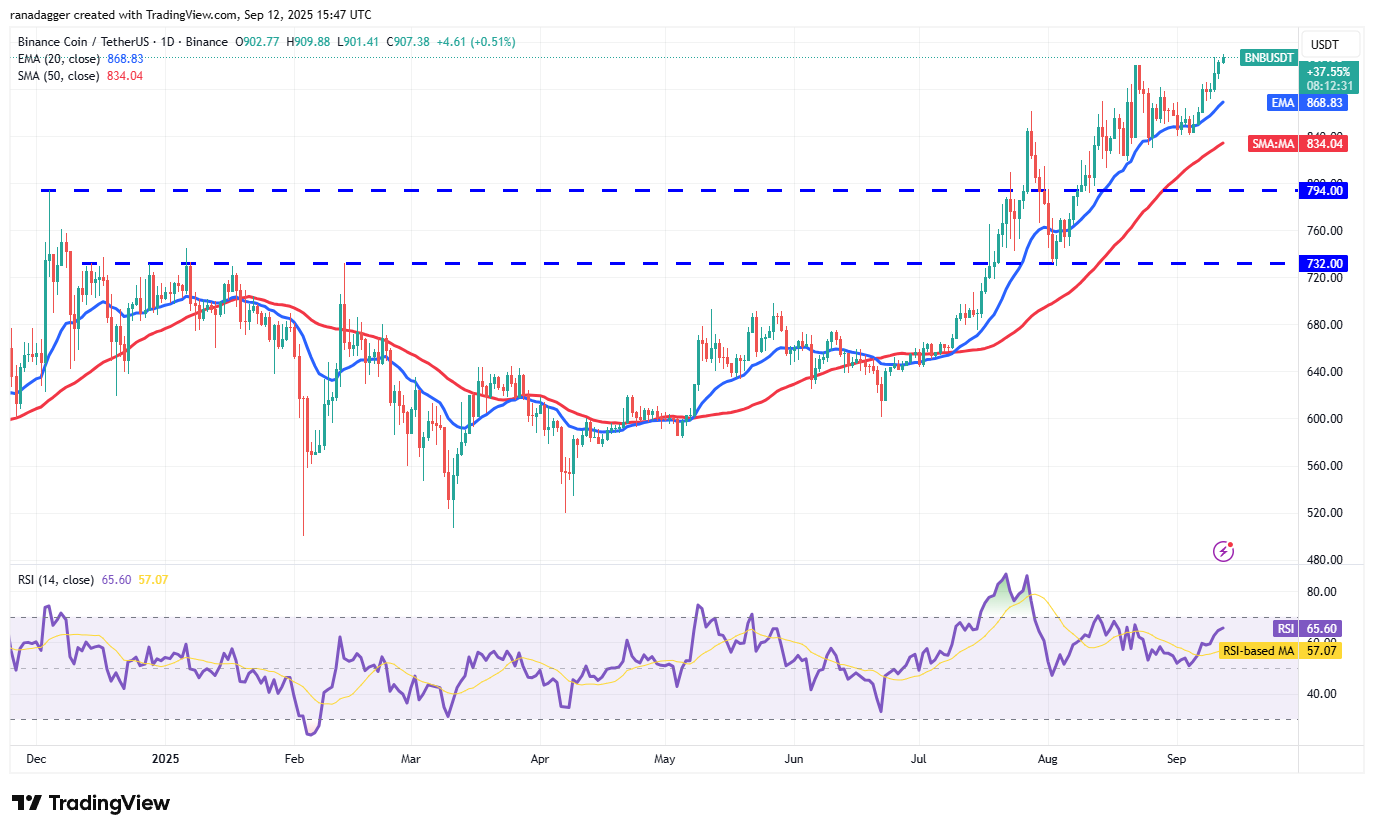
If buyers maintain the price above $900, the BNB/USDT pair could rally to the psychological level of $1,000. Sellers are expected to vigorously defend the $1,000 level, but if buyers defend the 20-day EMA ($868) on the way down, it signals a positive sentiment. The BNB price may then resume the uptrend to $1,090.
This optimistic view will be negated in the near term if the pair turns down and plummets below the 20-day EMA. The price may then tumble to the 50-day SMA ($834).
Solana price prediction
Solana (SOL) picked up momentum after breaking above the $218 resistance and is marching toward the $260 level.
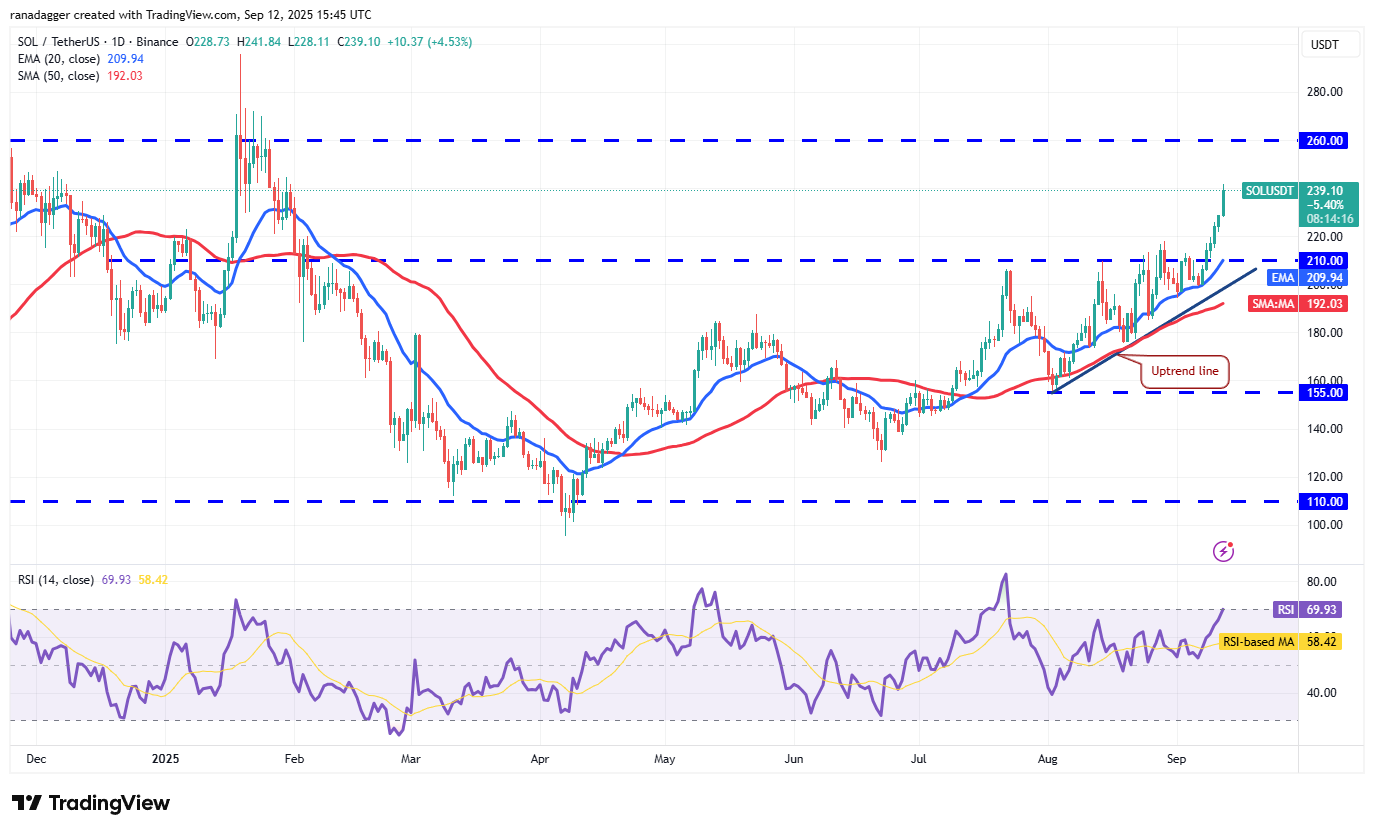
Sellers are likely to pose a strong challenge in the $240 to $260 overhead resistance zone. If the price turns down from the overhead zone, the bulls will try to arrest the pullback at the 20-day EMA ($209). If they manage to do that, the likelihood of a break above $260 increases. The SOL/USDT pair could then surge to $295.
The first sign of weakness will be a close below the 20-day EMA. That suggests profit booking by short-term traders. The Solana price may then slump to the uptrend line.
Dogecoin price prediction
Buyers are attempting to sustain Dogecoin (DOGE) above the $0.26 resistance, indicating strength.
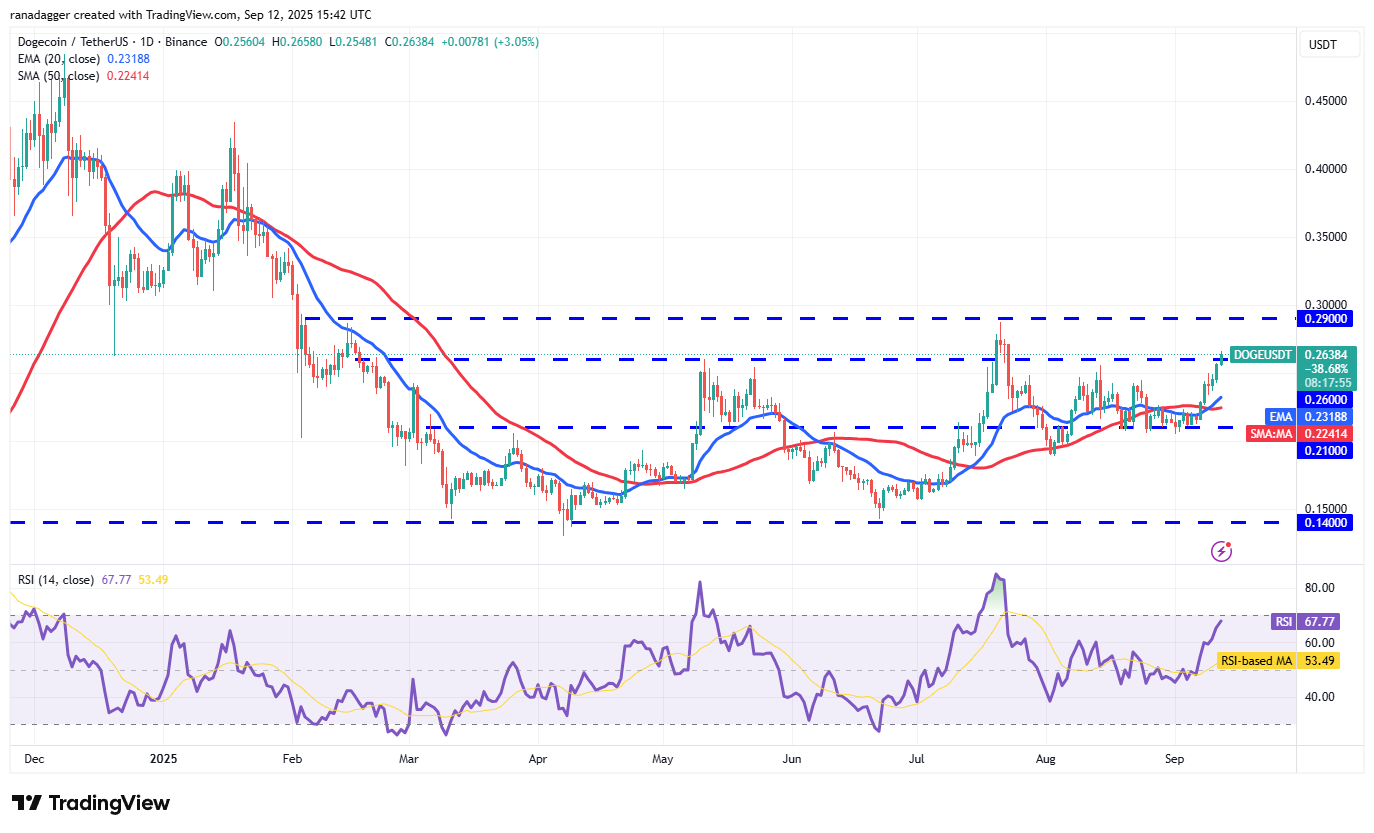
The DOGE/USDT pair may climb to the $0.29 overhead resistance, which is a critical level for the bears to defend. If buyers drive the price above $0.29, the pair could start a new up move toward $0.44.
Contrary to this assumption, if the Dogecoin price turns down sharply from the overhead resistance, it suggests that the pair could remain range-bound between $0.29 and $0.14 for a few more days.
Cardano price prediction
Cardano (ADA) closed above the downtrend line of the descending channel pattern on Wednesday, but the bears are unlikely to give up easily.
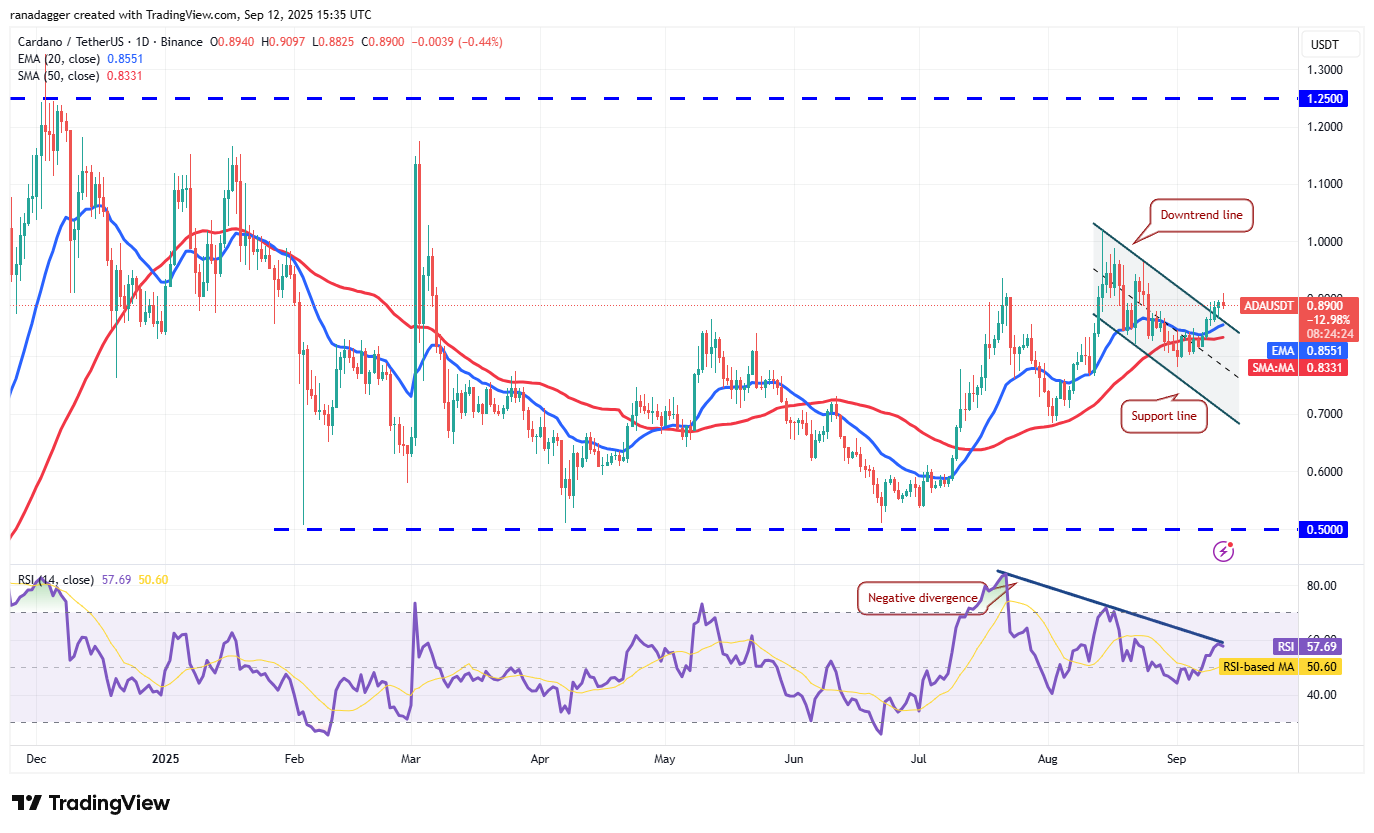
Sellers will try to pull the price back below the moving averages. If they manage to do that, several aggressive bulls may get trapped, pulling the ADA/USDT pair to the support line.
On the other hand, if the Cardano price rebounds off the 20-day EMA ($0.85), it suggests that the bulls are in control. Buyers will try to push the pair to $0.96 and then to $1.02, where the bears are expected to step in.
Related: Here’s what happened in crypto today
Chainlink price prediction
Chainlink (LINK) broke above the $24 resistance on Thursday, indicating that the bulls are trying to make a comeback.
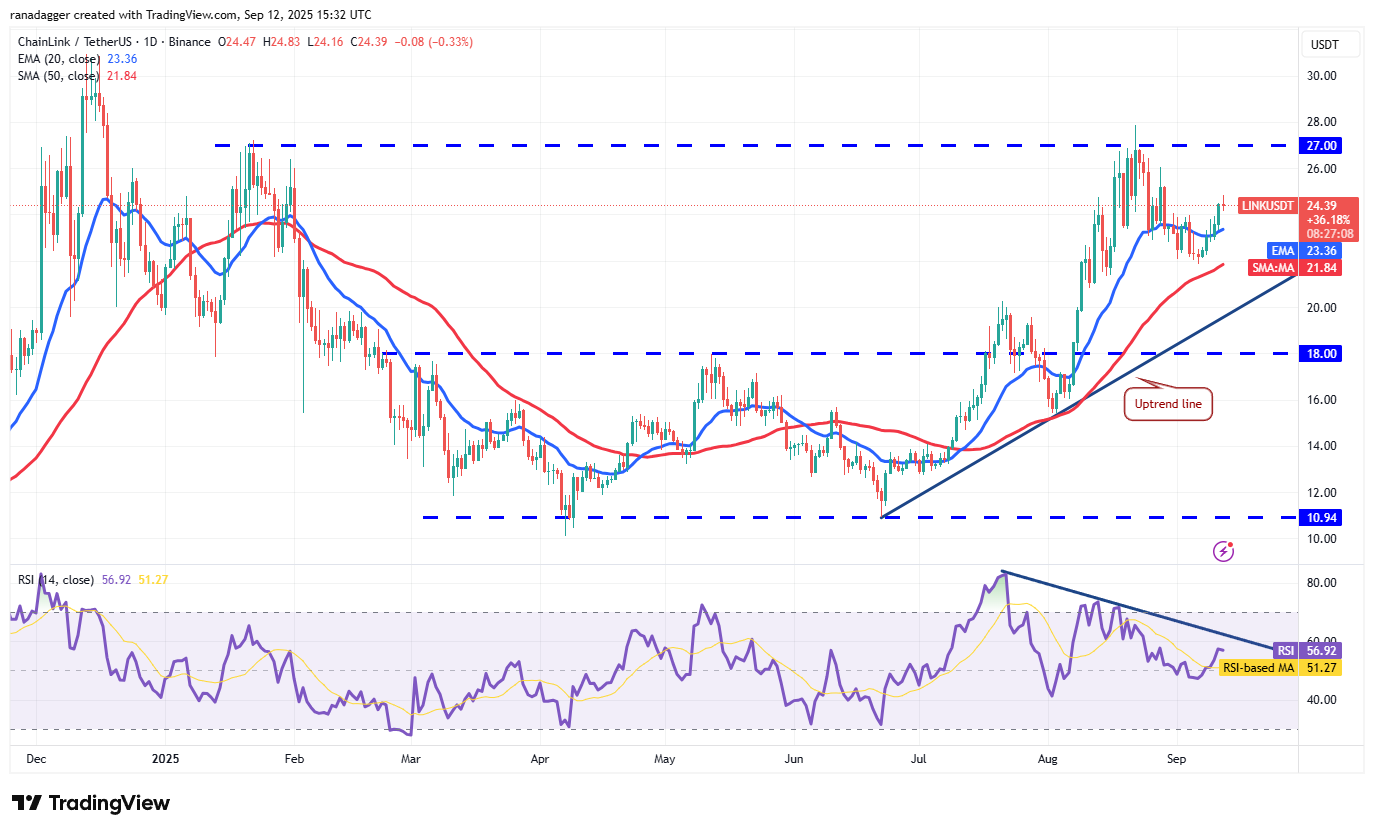
The 20-day EMA ($23.36) is the crucial support to watch out for on the downside. If buyers maintain the price above the 20-day EMA, the LINK/USDT pair could rally to the $26 to $28 overhead resistance zone.
Contrarily, a break and close below the 20-day EMA suggests a lack of demand at higher levels. The Chainlink price could slump to the 50-day SMA ($21.84) and later to the uptrend line.
Hyperliquid price prediction
Hyperliquid (HYPE) continued its march higher after breaking above the $49.88 resistance, indicating sustained demand from the bulls.
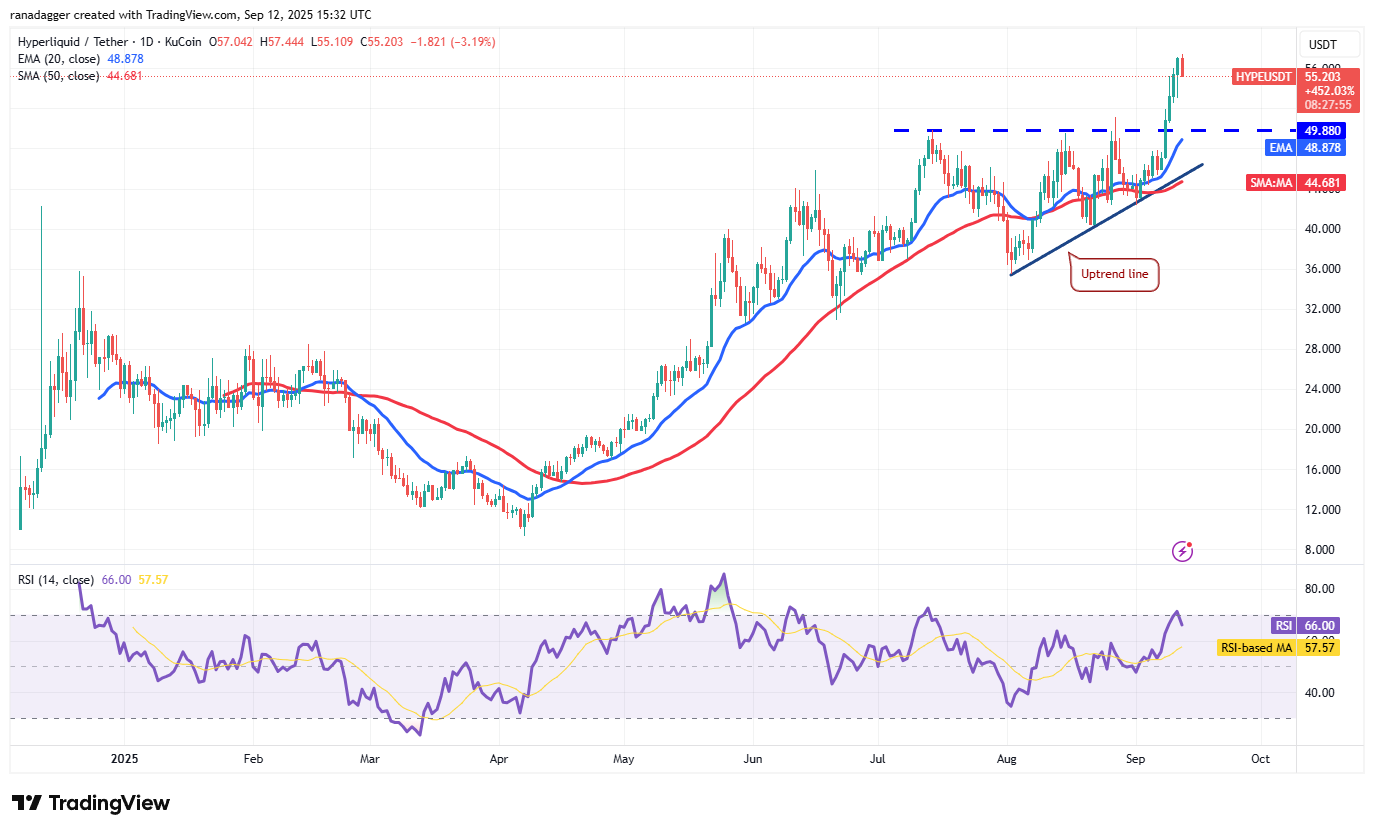
The rally had pushed the RSI into the overbought territory, increasing the risk of a pullback toward the breakout level of $49.88. If the price rebounds off the $49.88 level with force, it suggests that the bulls remain in charge. The HYPE/USDT pair could then attempt a rally to the pattern target of $64.25.
Sellers are likely to have other plans. They will strive to pull the price below the 50-day SMA ($44.68), signaling a short-term top.
Sui price prediction
Sui (SUI) is nearing the downtrend line, where the sellers are likely to mount a strong defense.
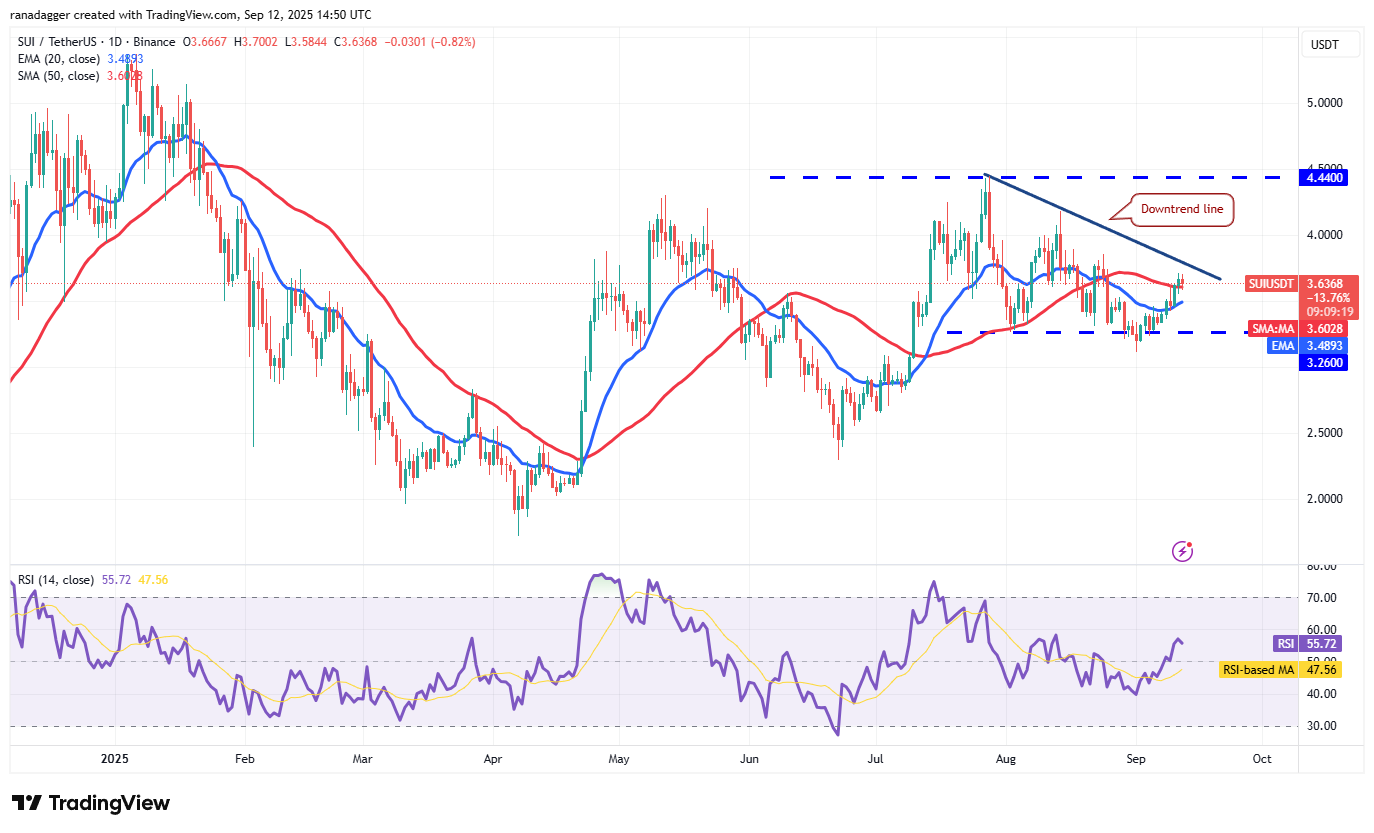
If the price turns down from the downtrend line but bounces off the 20-day EMA ($3.48), it signals a positive sentiment. That increases the likelihood of a break above the downtrend line. If that happens, the bearish setup will be invalidated, and the SUI/USDT pair could rally to $4.18.
Sellers will have to pull the Sui price below the 20-day EMA to retain the pair inside the triangle. The bears will gain the upper hand if they sink the price below $3.11.
This article does not contain investment advice or recommendations. Every investment and trading move involves risk, and readers should conduct their own research when making a decision.


