

Key takeaways:
-
A classic BTC price chart pattern puts $170,000-$360,000 in play this cycle.
-
Spot Bitcoin ETFs post the biggest inflows in two months as institutional demand rebounds.
Bitcoin (BTC) price action has painted two inverse head-and-shoulders patterns on the weekly time frame, which hint at BTC’s “supercycle ignition” to $360,000, according to analysts.
BTC price technical analysis puts $360,000 in play
An inverse head-and-shoulders pattern (IH&S) is a bullish chart formation that forms with three troughs: a lower “head” between two higher “shoulders.” As a technical rule, a breakout above the pattern’s neckline is often followed by a parabolic price rise.
Related: Bitcoin price can hit $160K in October as MACD golden cross returns
Bitcoin’s weekly chart shows two IH&S patterns, as shown in the figure below. The first is a smaller one formed since November 2024 and resolved in July when the price broke above the neckline at $112,000. The recent rebound from this level suggests the formation is playing out.
The measured target for this pattern, the height added to the breakout point, is $170,000, or up 49% from the current level.
The second is a bigger IH&S pattern that has been forming since March 2021, projecting an even higher target for the asset.
Bitcoin broke above the neckline around $73,000 in November 2024 in a post-US election rally that pushed BTC price above $100,000 for the first time.
Bitcoin’s drop to $74,400 in April retested this level to confirm the breakout. With the pattern still in play, BTC price could continue its uptrend toward the measured target of $360,000, up 217% from the current levels.
“The Bitcoin inverse head and shoulders of dreams has now doubled,” said analyst Merlijn The Trader in a Wednesday X post, adding:
“This isn’t a pattern. It’s the supercycle ignition.”
As Cointelegraph reported, a similar formation on the four-hour chart projects a short-term target of $120,000 for the Bitcoin price as long as bulls hold above $113,000.
Institutional demand for Bitcoin recovers
Bitcoin’s potential to rise higher is reinforced by the return of inflows into spot Bitcoin exchange-traded funds (ETFs).
These investment products posted inflows for three consecutive days, between Monday and Wednesday, totaling $1.15 billion, per data from SoSoValue.
The $752 million inflows recorded on Wednesday were the highest since mid-July, and show that institutional demand is rebounding.
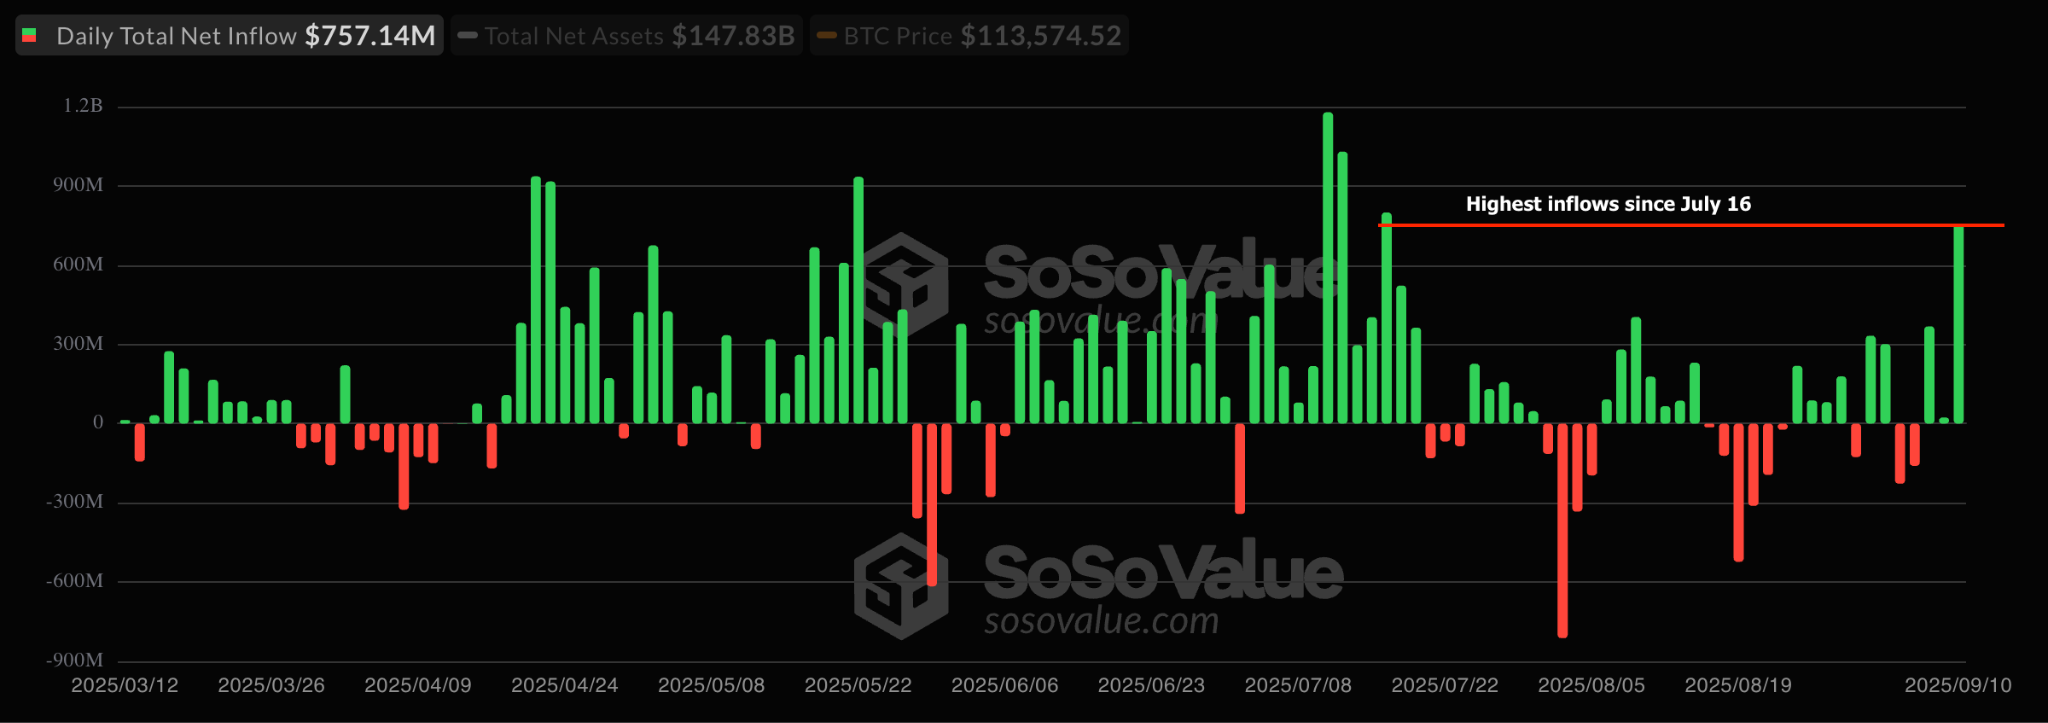
“Money is moving back into Bitcoin ETFs at a rapid rate as retailers impatiently drop out of crypto,” said market intelligence firm Santiment in a Wednesday X post, adding:
“Previous crypto rallies were boosted by inflow spikes like this.”
This article does not contain investment advice or recommendations. Every investment and trading move involves risk, and readers should conduct their own research when making a decision.


