

Key points:
-
Bitcoin could rally to $115,000 and then to $120,000, but the upside looks capped in the near term if the whales continue to sell.
-
Select altcoins look strong and ready to break above their overhead resistance levels.
Bitcoin (BTC) started the new week on a positive note with buyers attempting to sustain the price above $112,500, but the bears are unlikely to give up easily.
Market participants will have to keep a close watch on the whale activity in the next few days. According to CryptoQuant data, whales have sold 114,920 BTC over the past month, the largest whale sell-off since July 2022. Analysts believe continued selling by the whales could cap BTC’s up move for the next few weeks.
On the downside, traders are closely watching the $100,000 level. Popular trader ZYN said in a post on X that BTC had bottomed at the 0.382 Fibonacci retracement level in Q3 2024 and Q2 2025 and that may happen again. ZYN expects the worst-case scenario to be a 10% drop near $100,000, “before a 50% rally above $150,000.”
Another negative for BTC in the near term is that demand from BTC treasury companies continues to fall. Michael Saylor’s Strategy, the world’s largest holder of Bitcoin, acquired roughly 7,714 BTC in August, significantly less than the 31,466 BTC purchased in July.
Other treasury companies bought 14,800 BTC in August, a considerably smaller quantity than their record-high purchase of 66,000 BTC in June.
Could BTC overcome its overhead resistance? Will select altcoins start a new up move? Let’s analyze the charts of the top 10 cryptocurrencies to find out.
S&P 500 Index price prediction
The S&P 500 Index (SPX) made a new intraday all-time high on Friday, but the higher levels attracted profit booking.

The negative divergence on the relative strength index (RSI) suggests that the bullish momentum may be weakening. If sellers pull the price below the 50-day simple moving average (6,356), the index could start a deeper correction to the breakout level of 6,147.
On the other hand, if the price turns up from the moving averages, it suggests that the bullish sentiment remains intact. The buyers will then try to start the next leg of the uptrend to 6,700.
US Dollar Index price prediction
Buyers failed to maintain the US Dollar Index (DXY) above the moving averages, indicating selling on rallies.
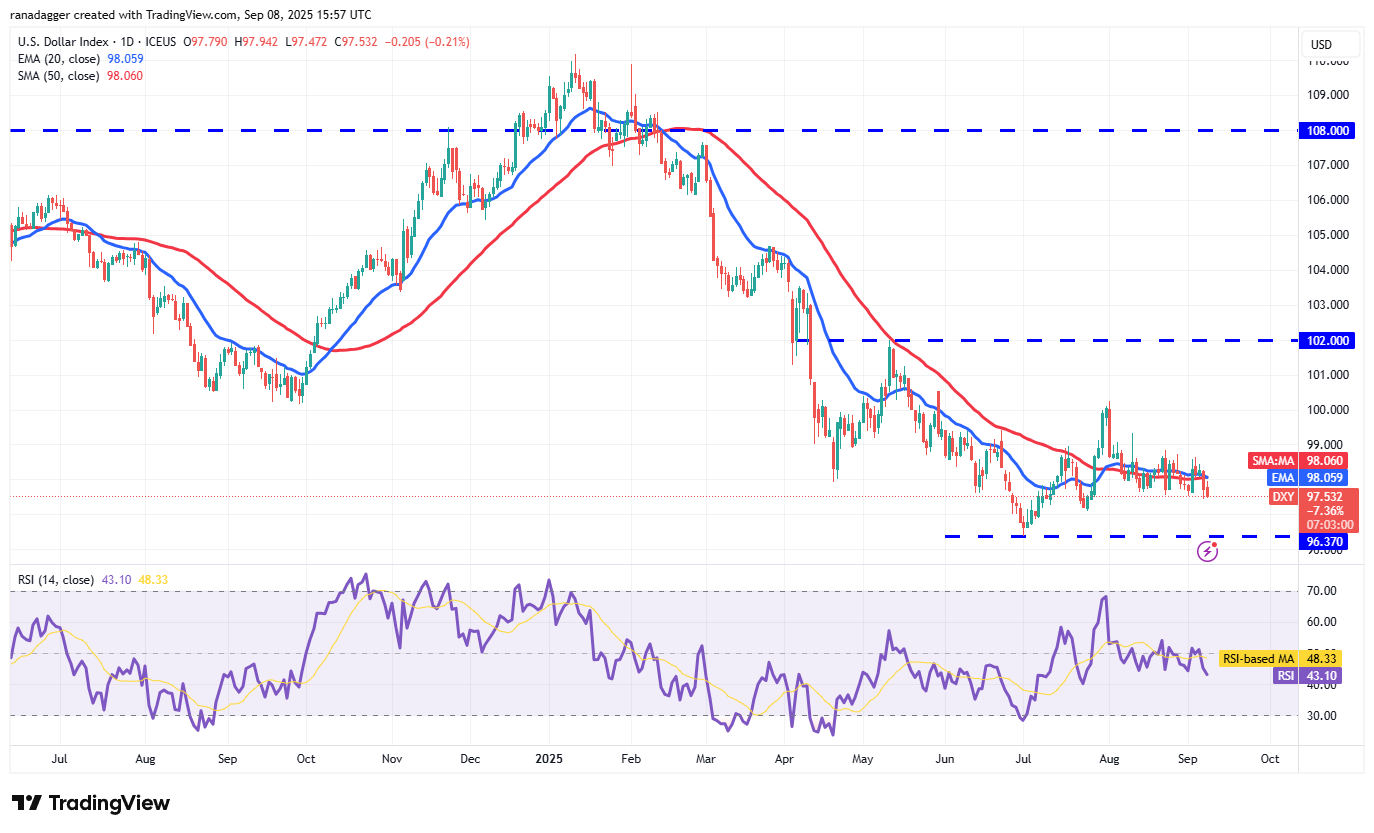
The bears will try to strengthen their position by pulling the price to 97.10 and then to the critical support at 96.37. Buyers are expected to fiercely defend the 96.37 support because a slide below it may sink the index to the 95 level.
Buyers will have to thrust the price above the 99 level to prevent the downside. If they manage to do that, the index could rally to 100.50 and eventually to the stiff overhead resistance at 102.
Bitcoin price prediction
BTC broke above the 20-day exponential moving average ($111,902) on Monday, indicating that the bulls are signaling a comeback.

The BTC/USDT pair could rally to the 50-day SMA ($114,920), where the bears are expected to step in. However, if buyers drive the Bitcoin price above the 50-day SMA, the pair may form a range. The price could swing between $107,000 and $124,474 for a while longer.
Alternatively, if the price turns down sharply from the current level or the 50-day SMA, it shows that the bears are trying to take charge. That increases the risk of a break below the $107,000 support. If that happens, the pair may collapse to $100,000.
Ether price prediction
ETH (ETH) has been trading near the 20-day EMA ($4,351) for the past few days, indicating uncertainty between the buyers and sellers.

The $4,060 level is the crucial support on the downside. A break and close below $4,060 could attract profit-booking from the short-term bulls. That may sink the ETH/USDT pair to $3,745 and later to $3,350.
On the upside, a break and close above $4,500 indicates that the bulls are back in the driver’s seat. The Ether price may then retest the overhead resistance of $4,956. A close above $4,956 opens the doors for a rally to $5,500.
XRP price prediction
XRP (XRP) climbed above the 20-day EMA ($2.90) on Monday, and the price is nearing the downtrend line.

Sellers are expected to defend the downtrend line vigorously because a break above it invalidates the bearish descending triangle pattern. That could trap the aggressive bears, pushing the XRP price to $3.40.
Contrarily, if the price turns down sharply from the downtrend line, it suggests that the XRP/USDT pair may remain inside the triangle for a while longer. The selling could intensify on a break below $2.73.
BNB price prediction
BNB (BNB) turned up from the $840 support on Friday and rose above the $861 resistance on Sunday.
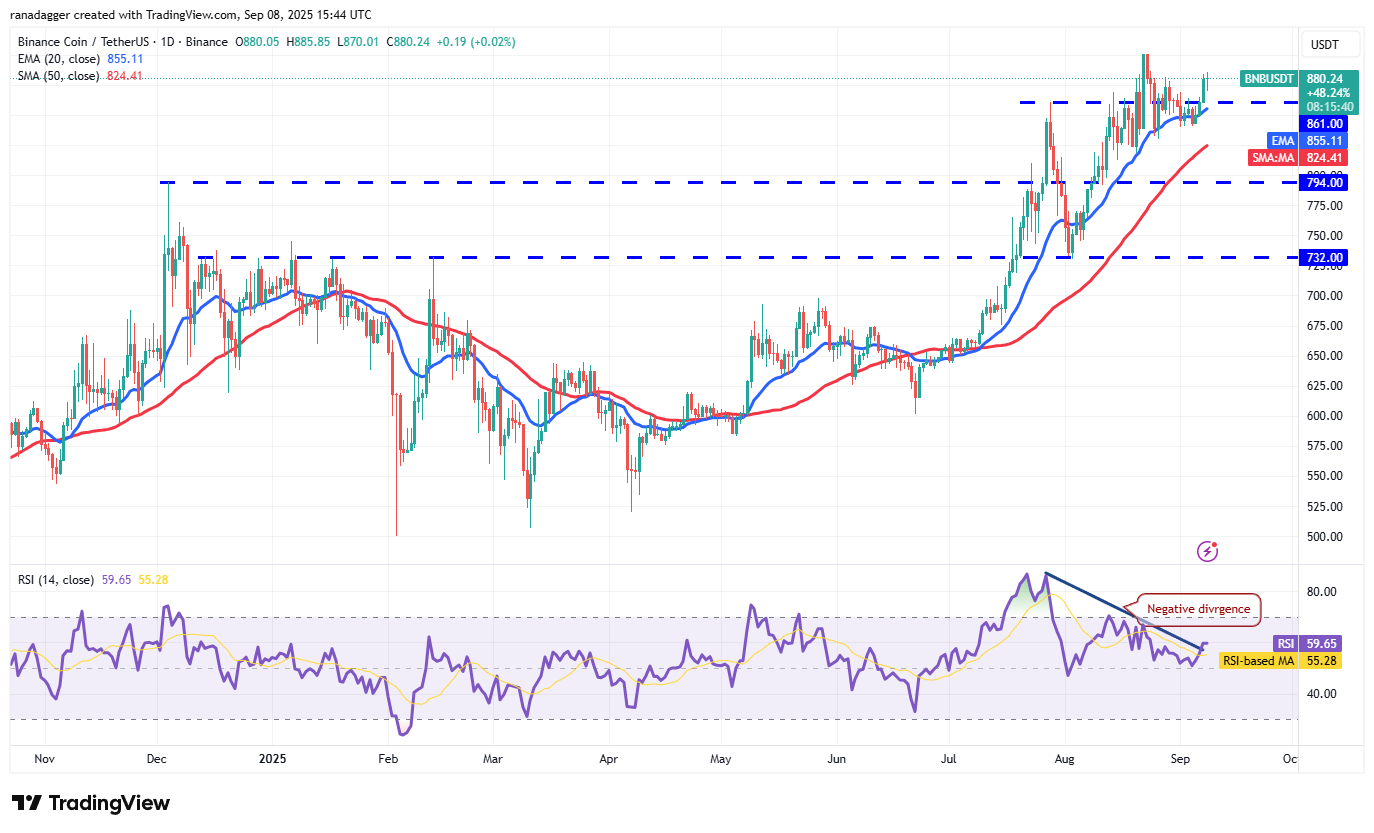
The up move may reach $900, where the bears are expected to mount a strong defense. If the price turns down from $900, but rebounds off the 20-day EMA ($855), it signals a positive sentiment. That improves the prospects of a break above $900. The BNB/USDT pair may then rally to $1,000.
Conversely, if the price turns down from the current level or the overhead resistance and breaks below $840, it suggests that the bulls are rushing to the exit. The BNB price may slump to the 50-day SMA ($824) and, after that, to $794.
Solana price prediction
Solana (SOL) bounced off the 20-day EMA ($201) on Sunday, indicating that the bulls continue to buy on dips.

The bulls are trying to drive the price above the $218 overhead resistance. If they manage to do that, the SOL/USDT pair will complete a bullish ascending triangle pattern. That clears the path for a rally to $240 and then to $260.
Sellers will have to successfully defend the $218 level and quickly tug Solana’s price below the 50-day SMA ($189) to prevent the upside move. The pair may then sink to $175.
Related: Can XRP keep outperforming Bitcoin this bull cycle?
Dogecoin price prediction
Dogecoin (DOGE) rose above the moving averages on Sunday, signaling that the price may remain inside the $0.21 to $0.26 range for a few more days.

The 20-day EMA ($0.22) has started to turn up, and the RSI has risen into the positive territory, indicating a slight advantage to the bulls. Sellers will try to defend the $0.26 level, but the DOGE/USDT pair could reach $0.29 if the bulls prevail. A close above $0.29 suggests the start of a new up move toward $0.44.
The $0.21 level is the critical support to watch out for on the downside. A break below it could sink the Dogecoin price to $0.19 and then to $0.16.
Cardano price prediction
Cardano (ADA) rose above the moving averages on Monday and is nearing the downtrend line of the descending channel pattern.

Sellers will strive to defend the downtrend line, but if buyers pierce the resistance, the corrective phase may be over. The ADA/USDT pair could pick up momentum and rally to $0.96 and subsequently to $1.02.
Instead, if Cardano’s price turns down from the downtrend line, it signals that the pair may remain inside the channel for some more time. The bears will gain the upper hand on a break below the channel’s support line.
Hyperliquid price prediction
Hyperliquid (HYPE) continues to march higher, rising above the $49.88 to $51.19 overhead resistance zone on Monday.

A close above $51.19 signals the completion of a bullish ascending triangle pattern. The HYPE/USDT pair may then resume its uptrend toward the pattern target of $64.25.
Contrary to this assumption, if the Hyperliquid price turns down sharply and re-enters the triangle, it suggests that the bears are active at higher levels. Sellers will have to sink the price below the uptrend line to negate the bullish setup. That could trap the aggressive bulls, pulling the pair to $40.
This article does not contain investment advice or recommendations. Every investment and trading move involves risk, and readers should conduct their own research when making a decision.


