
Key takeaways:
-
Bitcoin formed a bearish engulfing candle, indicating potential short-term exhaustion.
-
The Miners’ Position Index surged to its highest level since November 2024, and profit-taking hit record highs.
-
Despite panic selling, over 196,600 BTC was accumulated in the $116,000–$118,000 range, reinforcing traders’ bullish long-term sentiment.
Bitcoin (BTC) printed its first notable bearish signal on the daily chart since early May, forming a bearish engulfing candle confirmed by a shooting star pattern. This comes after a 19% rally over the past 21 days, possibly signaling exhaustion.
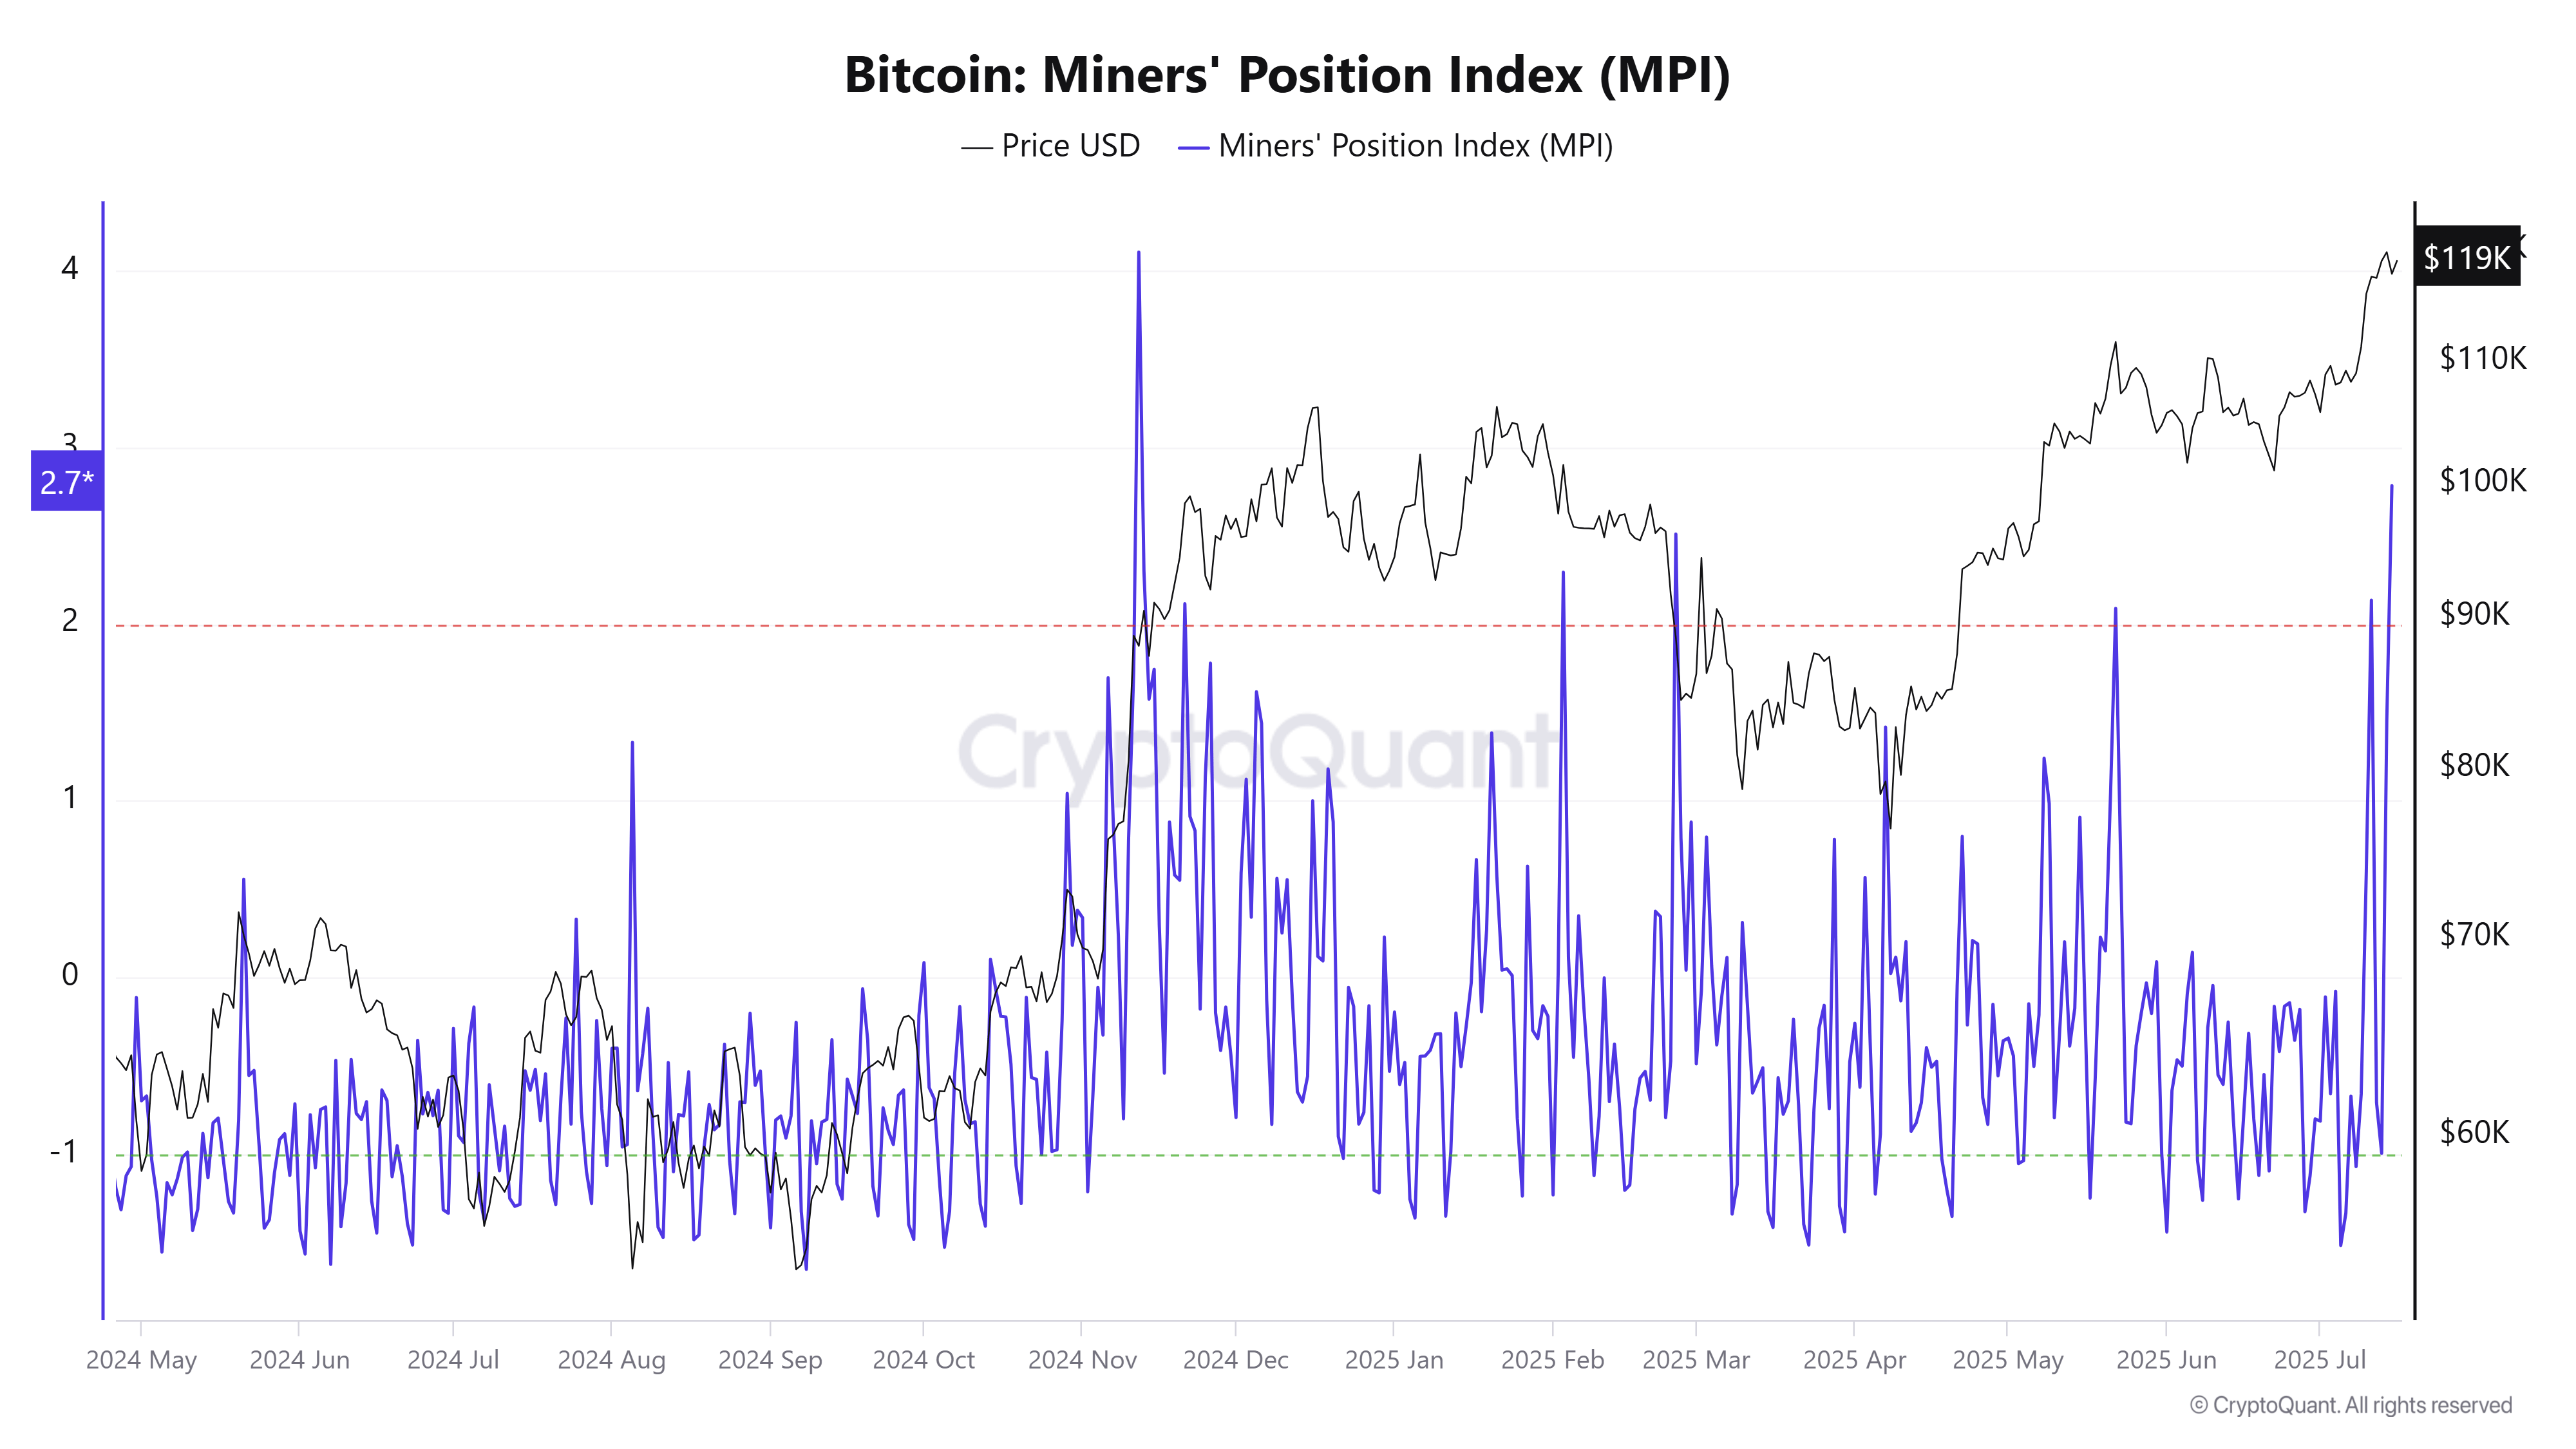
Data from CryptoQuant highlighted that the Miners’ Position Index (MPI) surged above 2.78, its highest level since November 2024. The MPI measures how much Bitcoin miners send to exchanges relative to its one-year average. A high reading suggests an increased likelihood of selling. While this may add short-term pressure, the spike remains well below levels typically seen near bull market tops.
Adding to this cautionary outlook, realized profit and loss (P&L) from BTC deposits to centralized exchanges hit an all-time high of $9.29 billion, signaling aggressive profit-taking. Crypto analyst Crazzyblockk explained that these metrics point to a high-risk zone where short-term volatility may intensify, even as the broader bullish trend remains intact.
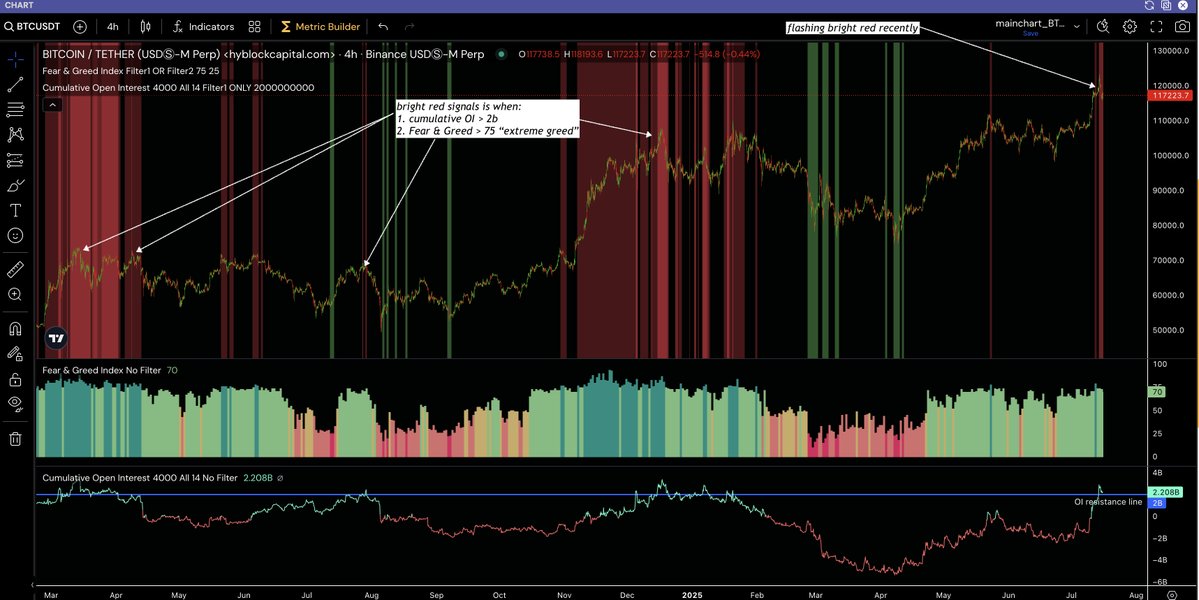
Meanwhile, trading platform Hyblock Capital noted that Bitcoin open interest is “approaching frothy levels.”
“Historically when this happens [and] Fear & Greed Index is in “Extreme Greed” territories –> we get local tops and corrections. Those bright red highlights are when both conditions occur. Historically, these play out over much longer timeframes, so don't go rushing into a trade right away.”
Related: Bitcoin digests US PPI win with $120K liquidity grab on bulls' radar
Is it time for Bitcoin holders to panic or have patience?
Bitcoin’s recent dip triggered a wave of panic selling, with nearly 50,000 BTC offloaded at a loss within 24 hours, according to Bitcoin researcher Axel Adler Jr. This sharp reaction underscored investor anxiety following BTC’s decline from recent highs.
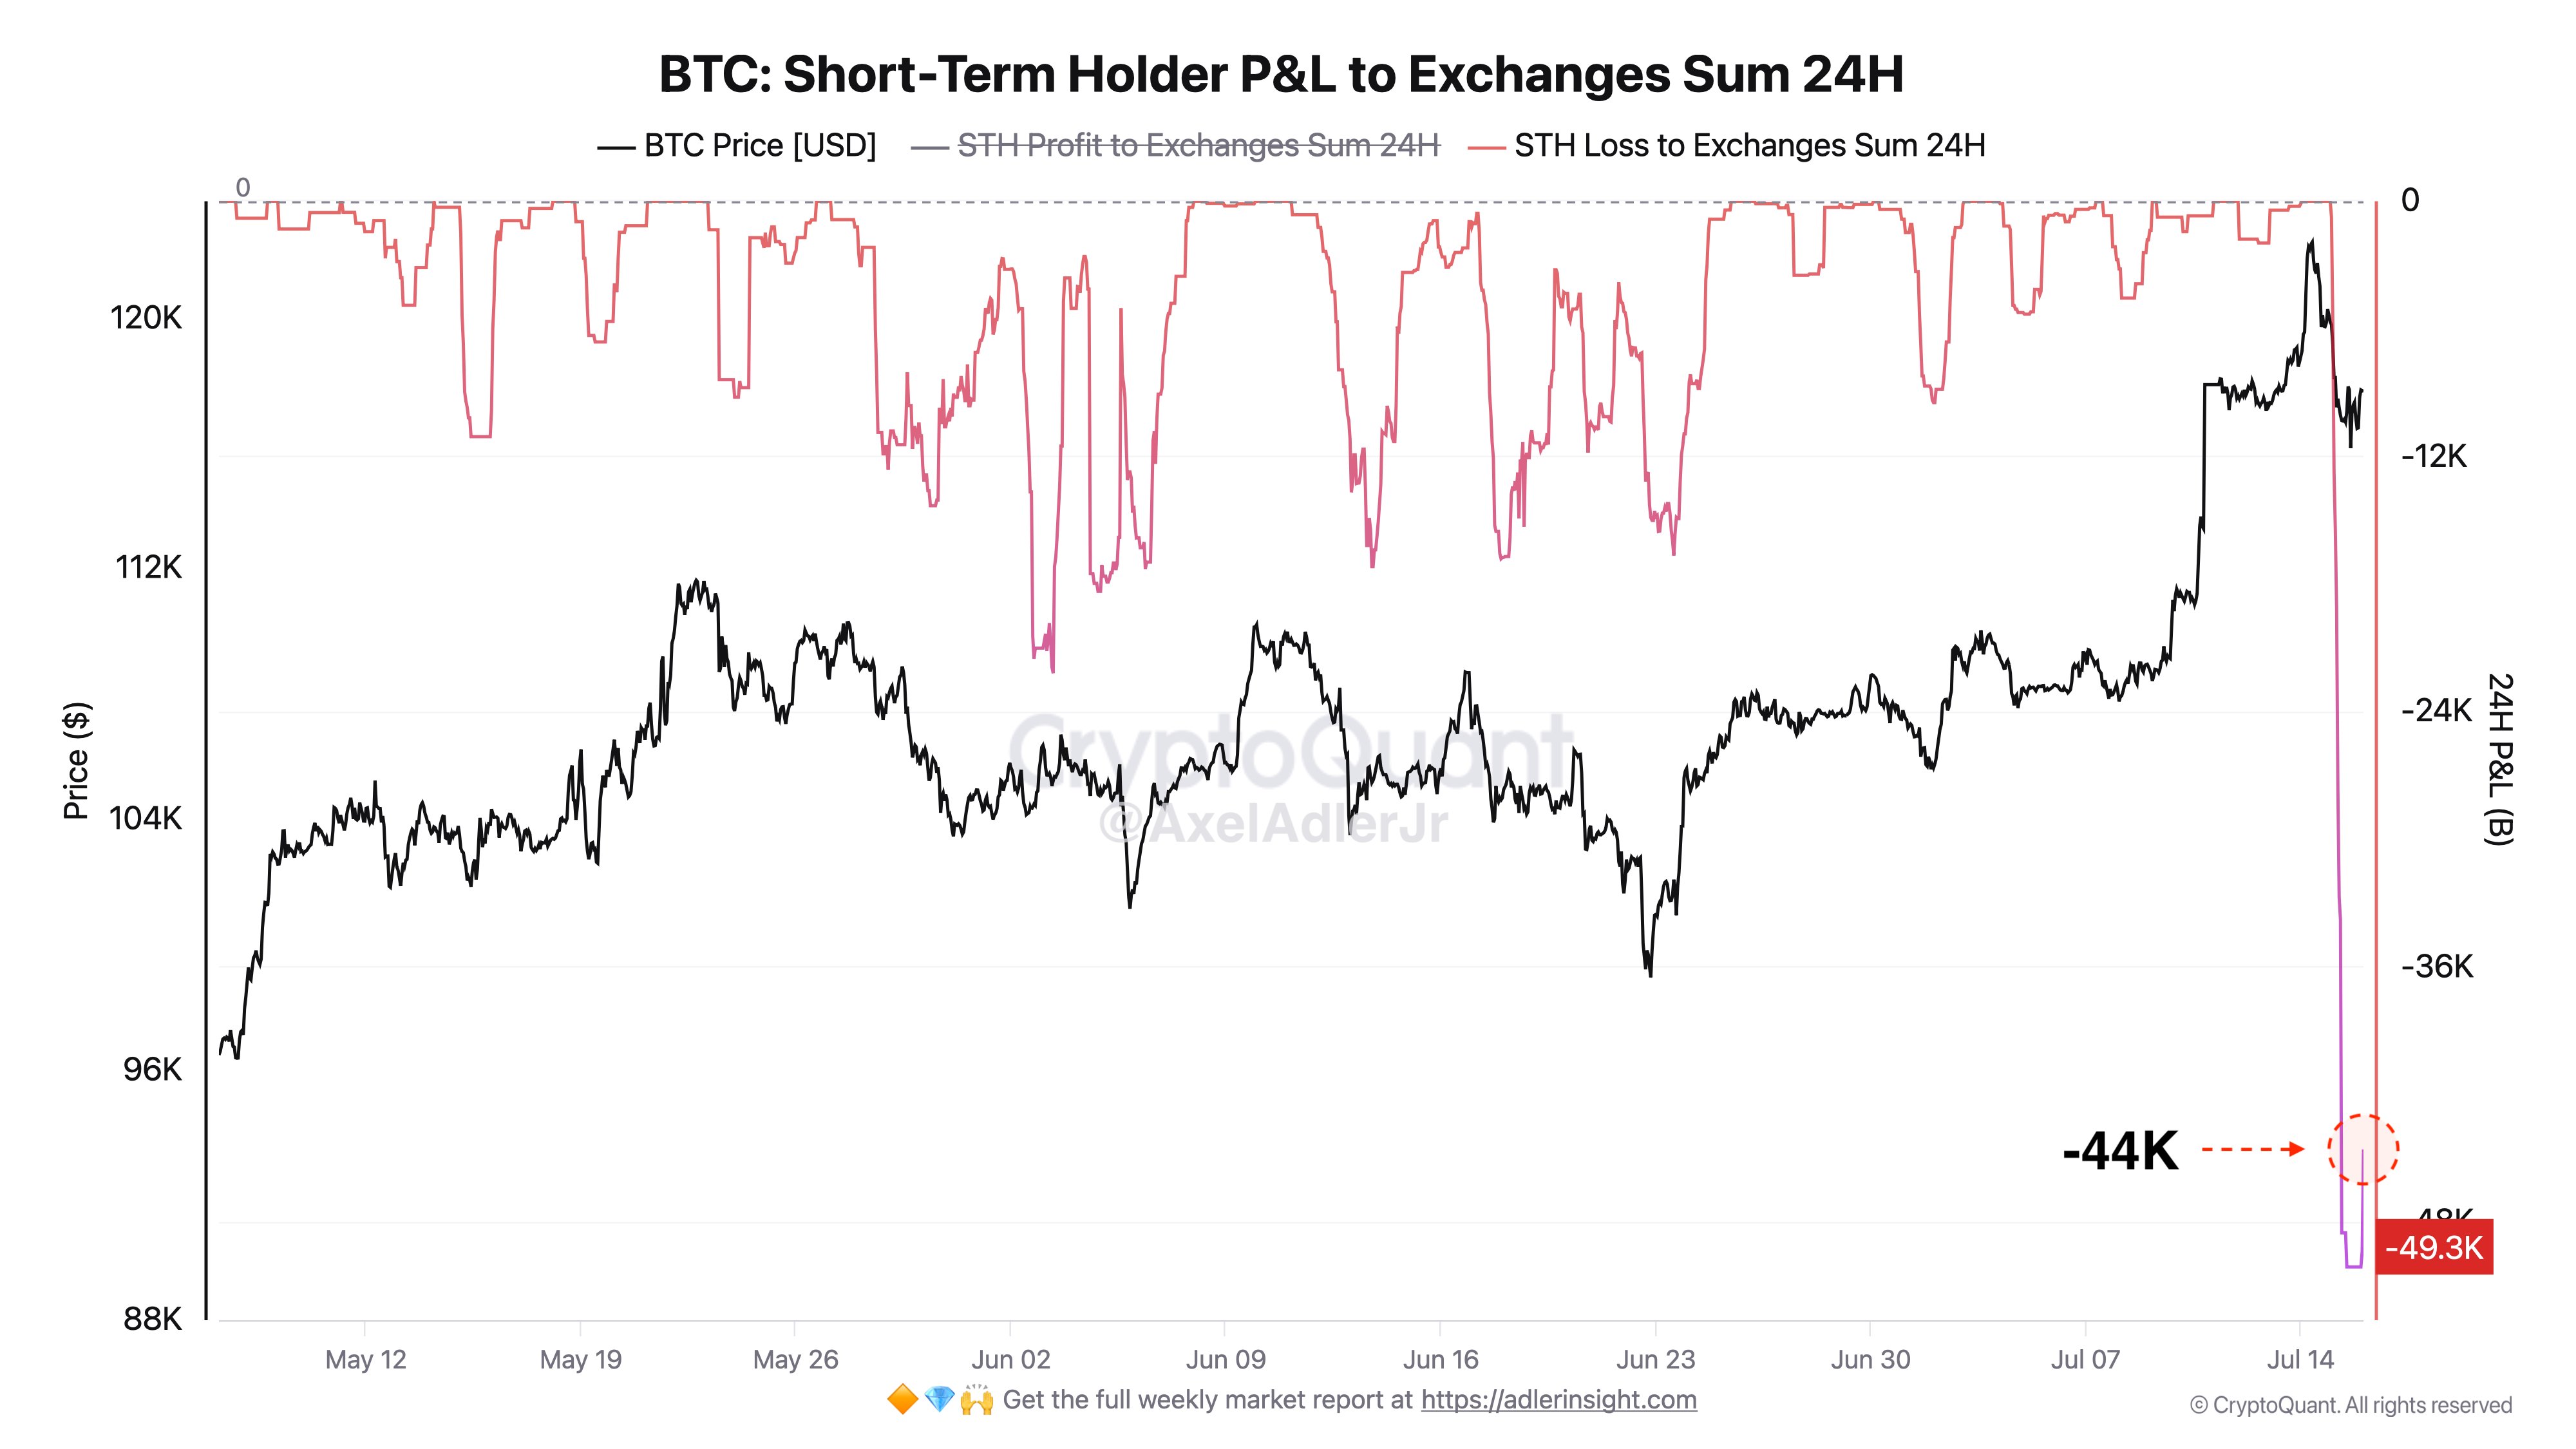
However, data suggests the pullback was met with stronger buying interest. Bitcoin’s cost basis distribution heatmap shows that investors accumulated over 196,600 BTC, worth more than $23 billion, between $116,000 and $118,000. Thus, despite signs of fear-driven selling, the substantial dip-buying underscores continued market confidence and conviction in Bitcoin’s longer-term trajectory.
From a technical perspective, Bitcoin remains firmly within its bullish long-term structure as long as it consolidates above the $112,000 level. Following a 19% rally, a period of sideways movement or a minor pullback is a healthy reset, allowing the market to cool off, flush out excess leverage, and shake out weaker hands.
While the recent bearish engulfing pattern may signal short-term exhaustion or a potential reversal, it does not yet invalidate the broader uptrend. As long as key support levels hold around $112,000, the probability of BTC resuming its upward momentum remains high.
Related: Bitcoin ‘not at peak yet': Watch these BTC price levels next
This article does not contain investment advice or recommendations. Every investment and trading move involves risk, and readers should conduct their own research when making a decision.


