Key takeaways:
-
Bitcoin’s sharp rebound after Jackson Hole fizzled into a bearish weekly engulfing candle.
-
Onchain data shows $105,000 as the key support as mid-size wallets sell.
-
Seasonal weakness and spot BTC ETF fatigue raise risks of a drop toward $100,000–$92,000.
Bitcoin (BTC) posted a sharp rebound on Friday, gaining 3.91% to $117,300 from $111,700 after dovish commentary from the Jackson Hole symposium boosted risk appetite.
It marked BTC’s strongest daily return since July 10, fueling optimism for another leg toward fresh all-time highs. However, momentum quickly evaporated, with Bitcoin reversing over the weekend and sliding to $110,600 on Monday.
A bearish weekly engulfing candle underscores downside vulnerability, as onchain data points to broad distribution among holders.
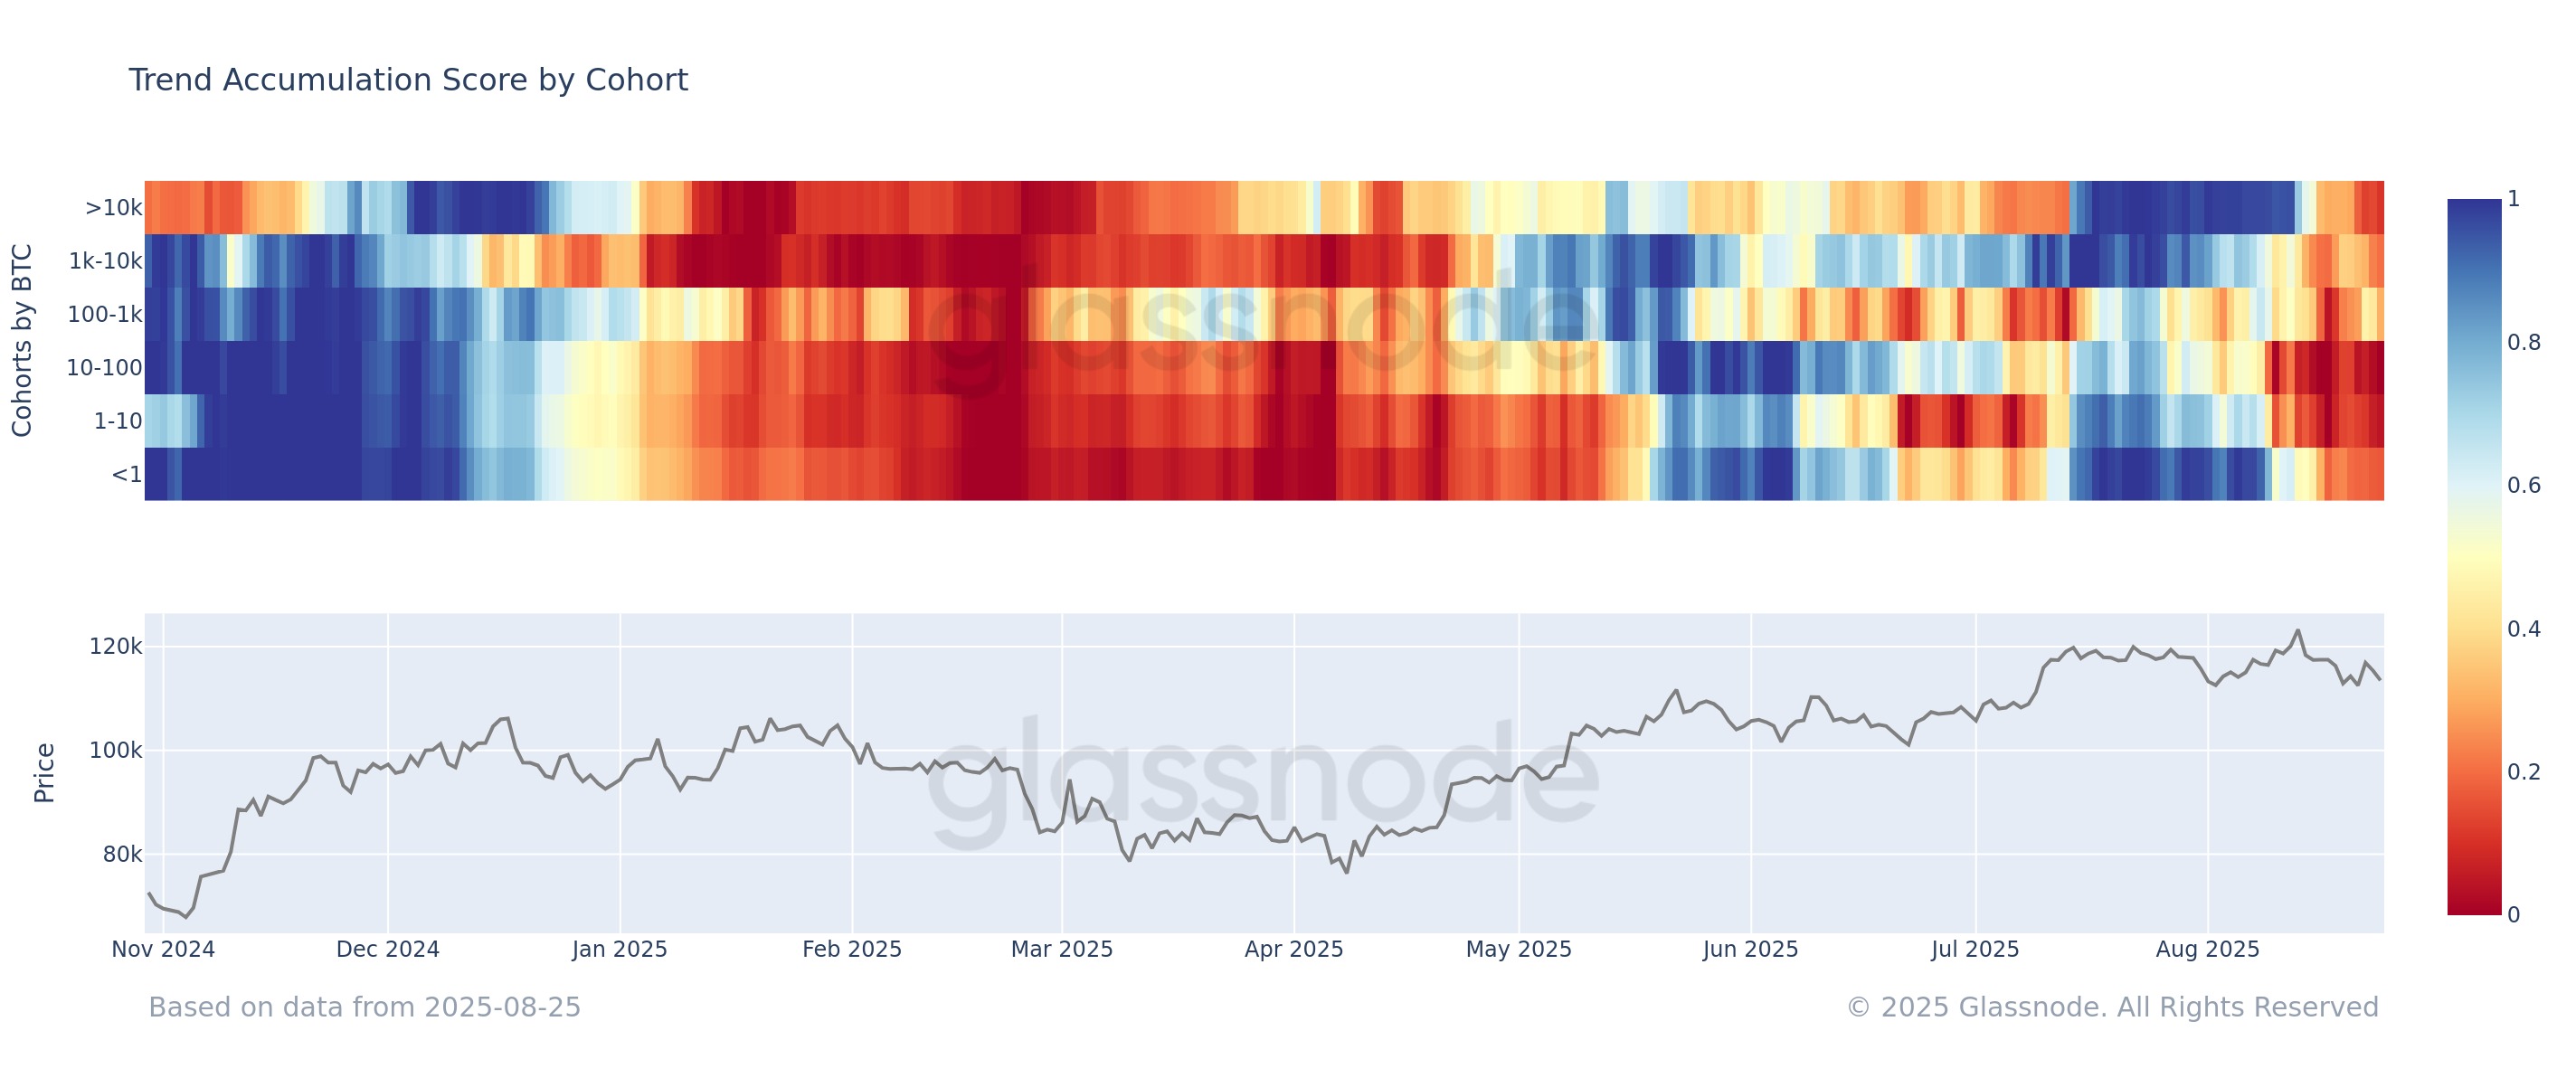
Data from Glassnode shows all BTC wallet cohorts have now shifted into distribution, led by the 10–100 BTC group. The synchronized behavior across wallet sizes highlights uniform sell-side pressure, weighing on price stability.

Similarly, analyst Boris Vest notes a split across wallet behavior: smaller holders (0–1 BTC) have steadily accumulated since the peak, while 1–10 BTC wallets resumed buying below $107,000. By contrast, 10–100 BTC wallets flipped to net sellers after $118,000, while large holders above 1,000 BTC remain consistent distributors.
However, the 100–1,000 BTC group is split between accumulation and distribution around $105,000, marking it as the key support zone and the last stronghold before major corrections.
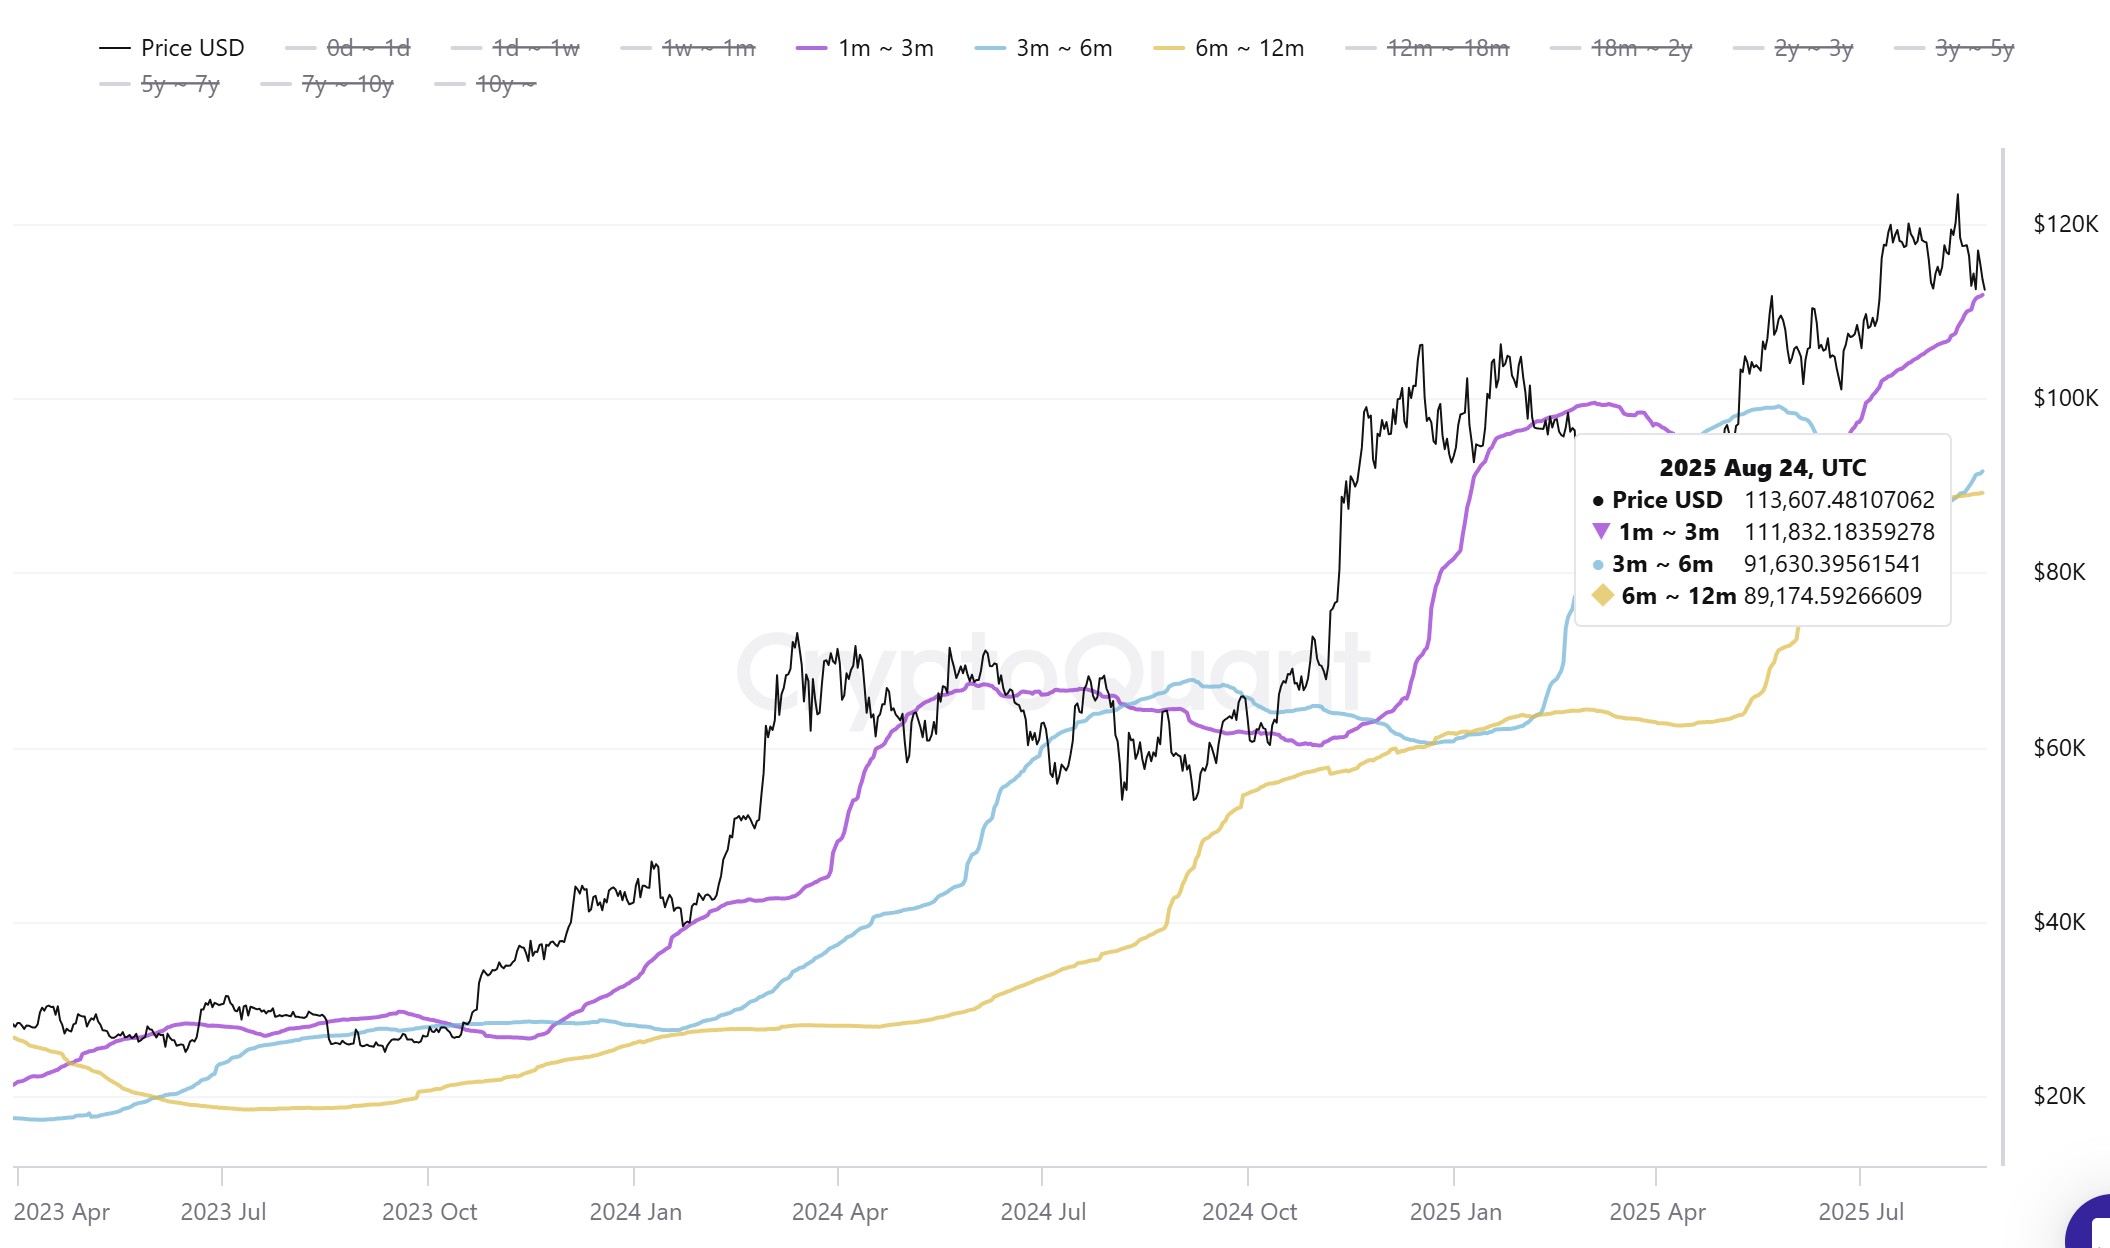
Bitcoin realized price data underscores this inflection. The realized price for one to three-month holders sits at $111,900, while the three to six-month and 6–12 month cohorts are anchored much lower at $91,630 and $89,200, respectively.
The wide gap reflects heavy short-term positioning near recent highs, versus longer-term holders with cost bases closer to $90,000.

Market analysis suggests that if Bitcoin loses $105,000, the lack of dense cost support between current levels and $90,000 could accelerate downside momentum. Such a breakdown could force recent buyers to capitulate, leaving the $92,000–$89,000 range as the next major demand zone.
Related: Bitcoin late longs wiped out as sub-$110K BTC price calls grow louder
Bitcoin seasonality and ETF fatigue kick in
The current pullback also aligns with Bitcoin’s seasonal tendencies. Historically, August to September has marked a period of weakness, often amplified by Asia’s “ghost month,” which runs this year from Aug. 23 to Sept. 21. Cointelegraph reported that this period has often coincided with softer risk appetite and profit-taking among traders.
Since 2017, Bitcoin has posted an average ghost month decline of 21.7%, with notable drops of –39.8% in 2017 and –23% in 2021. Based on these averages, a retreat toward the $105,000–$100,000 range remains consistent with seasonal patterns and technical support zones.
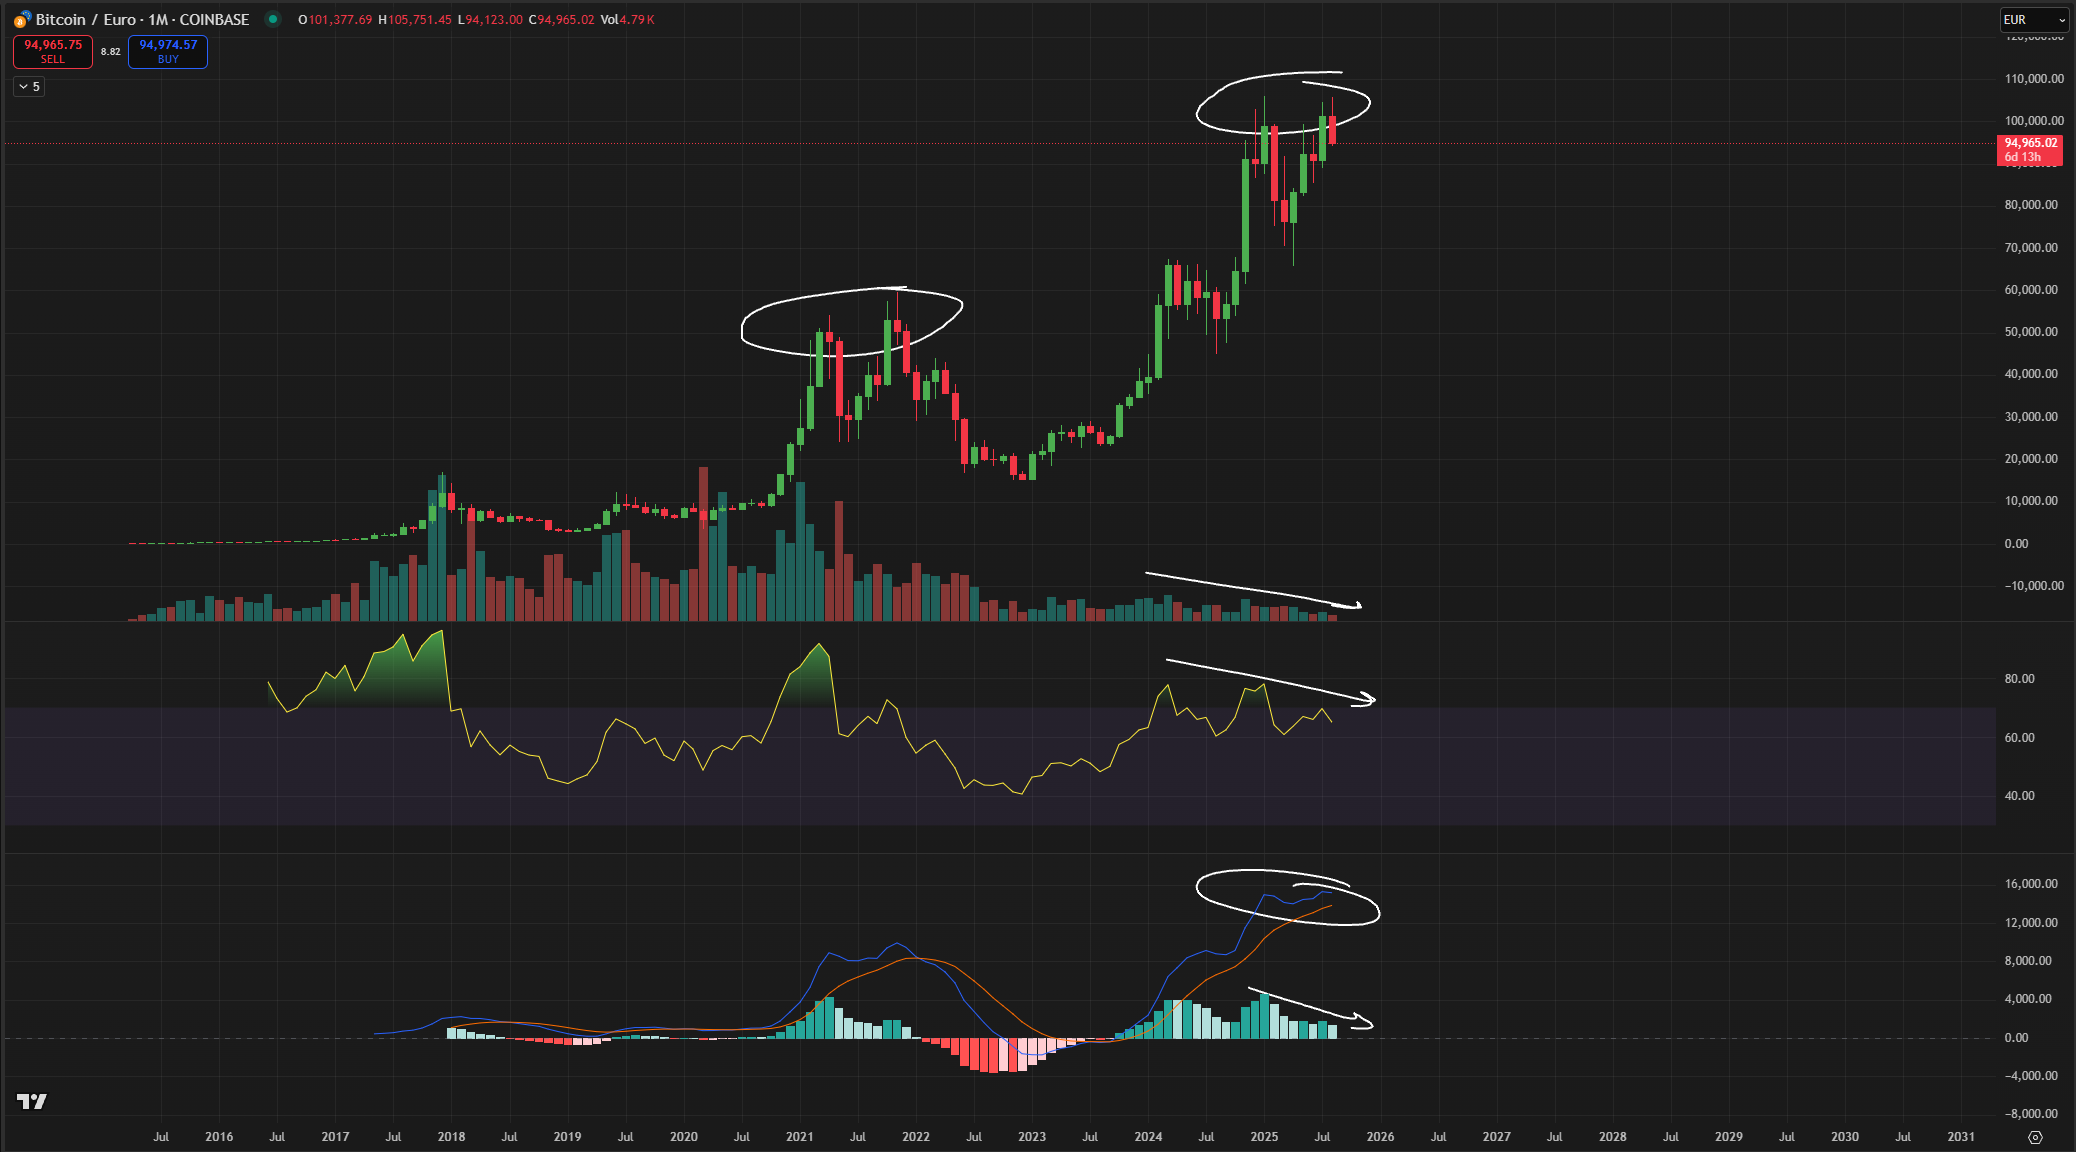
Adding to the cautious tone, crypto trader Roman Trading flags structural risks in BTC’s current rally. The analyst said that BTC/EUR has not registered a new all-time high since last year, suggesting that recent upside is more closely tied to a weakening US dollar than organic demand.
Roman further warns that the post-spot Bitcoin exchange-traded fund (ETF) launch enthusiasm may be fading, with higher-timeframe exhaustion resembling past distribution phases.

Related: Bitcoin OG whales to blame for BTC’s painful rise: Willy Woo
This article does not contain investment advice or recommendations. Every investment and trading move involves risk, and readers should conduct their own research when making a decision.


