

Key points:
-
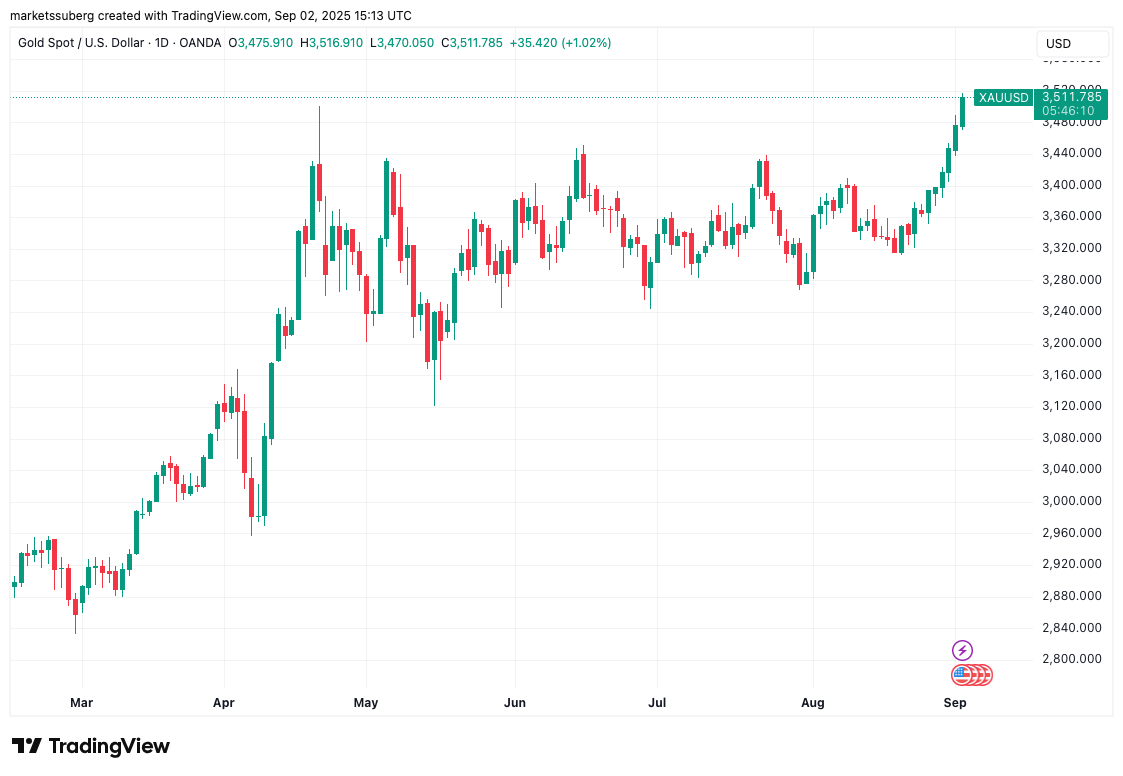
Bitcoin moves in step with gold, rising toward $112,000 as gold hits new all-time highs.
-
BTC price action has yet to confirm a reversal, say commentators, with the risk of a $100,000 dip still real.
-
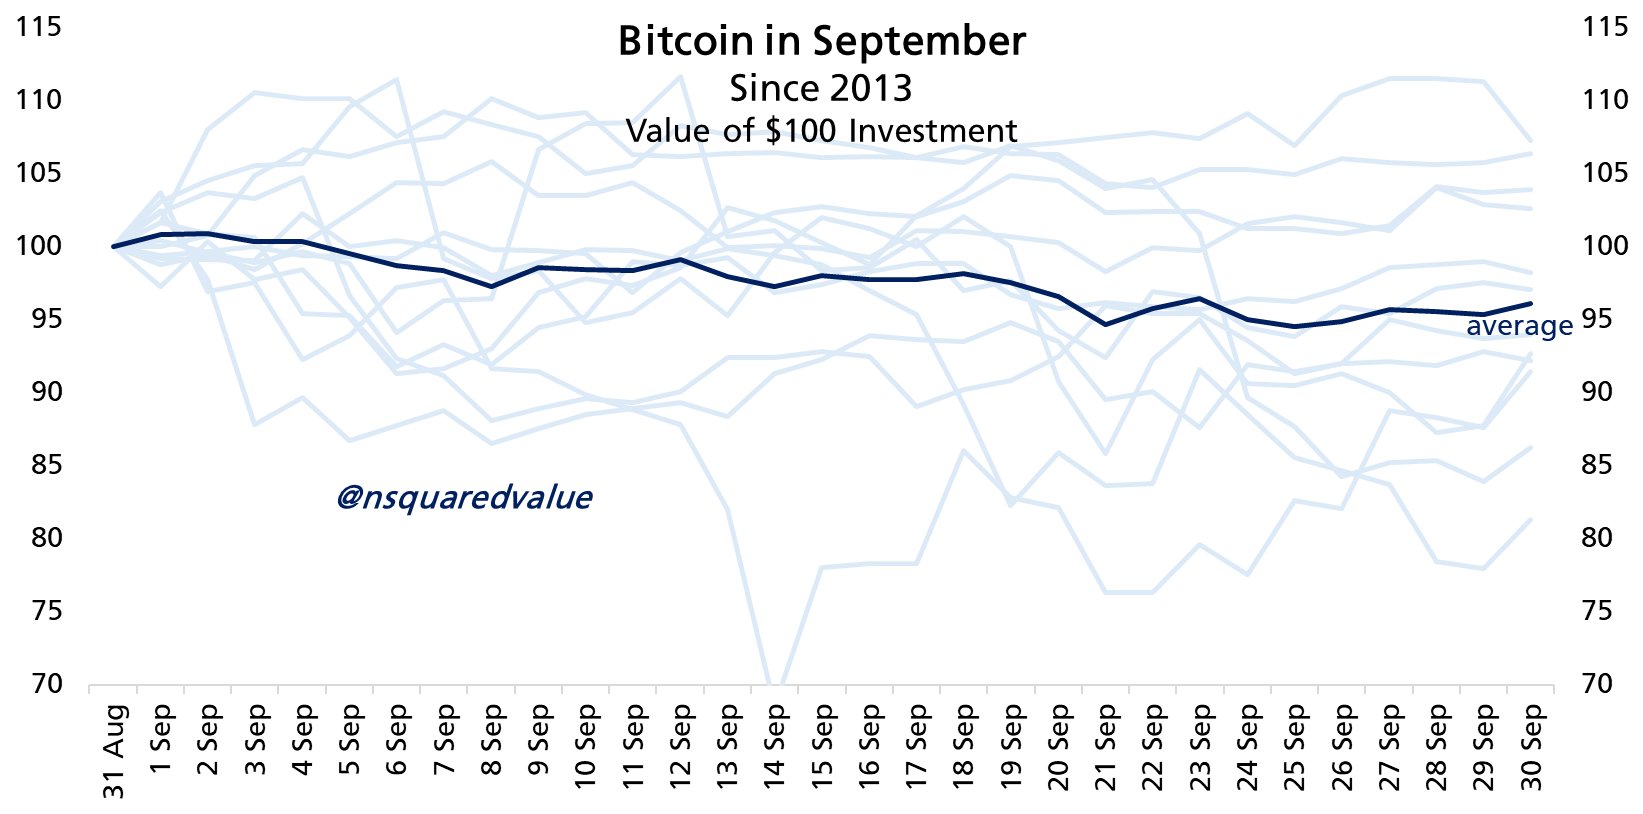
September seasonality means that week three of the month is all but guaranteed to see losses.
Bitcoin (BTC) surged with gold at Tuesday’s Wall Street open as bulls crunched through short liquidity.
Trader: BTC price still due $100,000 dip
Data from Cointelegraph Markets Pro and TradingView showed BTC/USD hitting new September highs of $111,775 on Bitstamp.
Up nearly 2% on the day, the pair joined gold as the latter hit fresh all-time highs above $3,500 per ounce. This was built on a breakout that began following the US macroeconomic data on Friday.
Bitcoin punished bearish bets, with CoinGlass data showing around $60 million of four-hour crypto short liquidations at the time of writing.

Reacting, crypto market commentators were in “wait and see” mode.
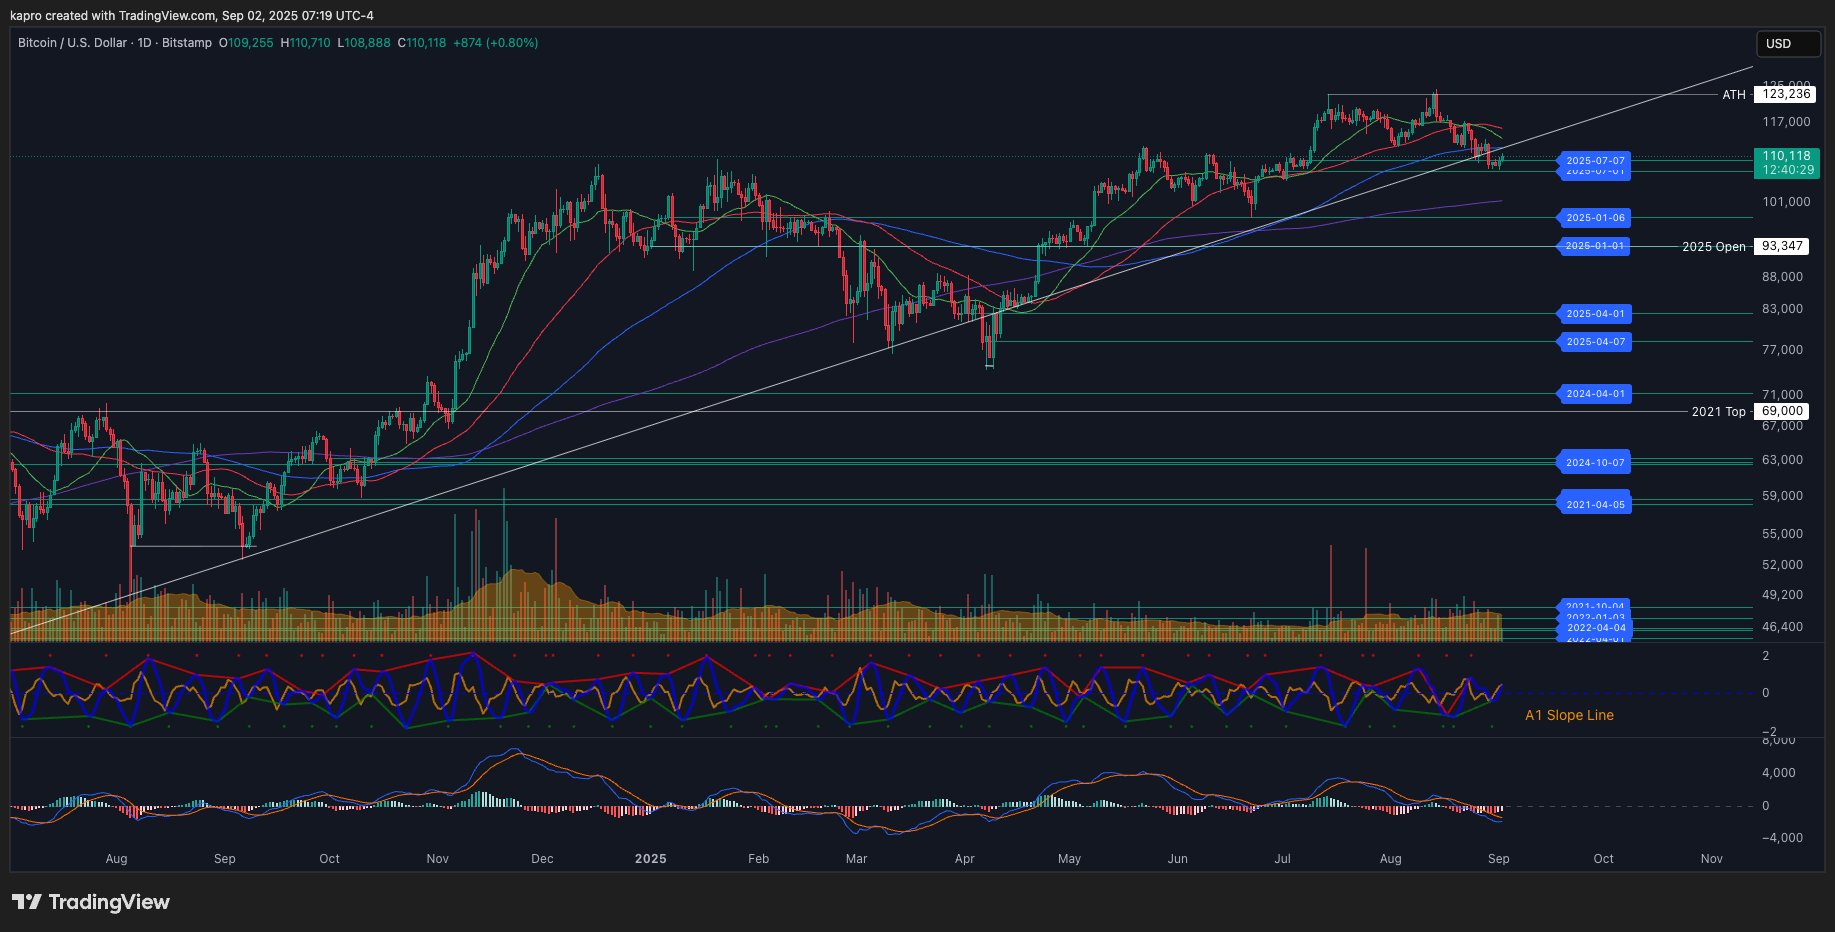
Uploading a chart from one of its proprietary trading tools to X, Material Indicators co-founder Keith Alan stressed the importance of the 21-day simple moving average (SMA).
“Strong technical resistance lives where the 100-Day SMA has confluence at the Trend Line,” he wrote in part of accompanying commentary.
“BTC Bulls need to R/S Flip that too to prevent a Death Cross between the 21-Day/100-Day MAs.”
Crypto expert Marcus Corvinus described a “critical moment” for BTC price strength.
“Price has been riding an uptrend but now sitting at the bottom of the channel,” he told X followers in part of a post.
“Heavy bearish candles closed, signaling buyers are losing grip. A breakdown here could confirm the end of the uptrend → start of a fresh downtrend.”
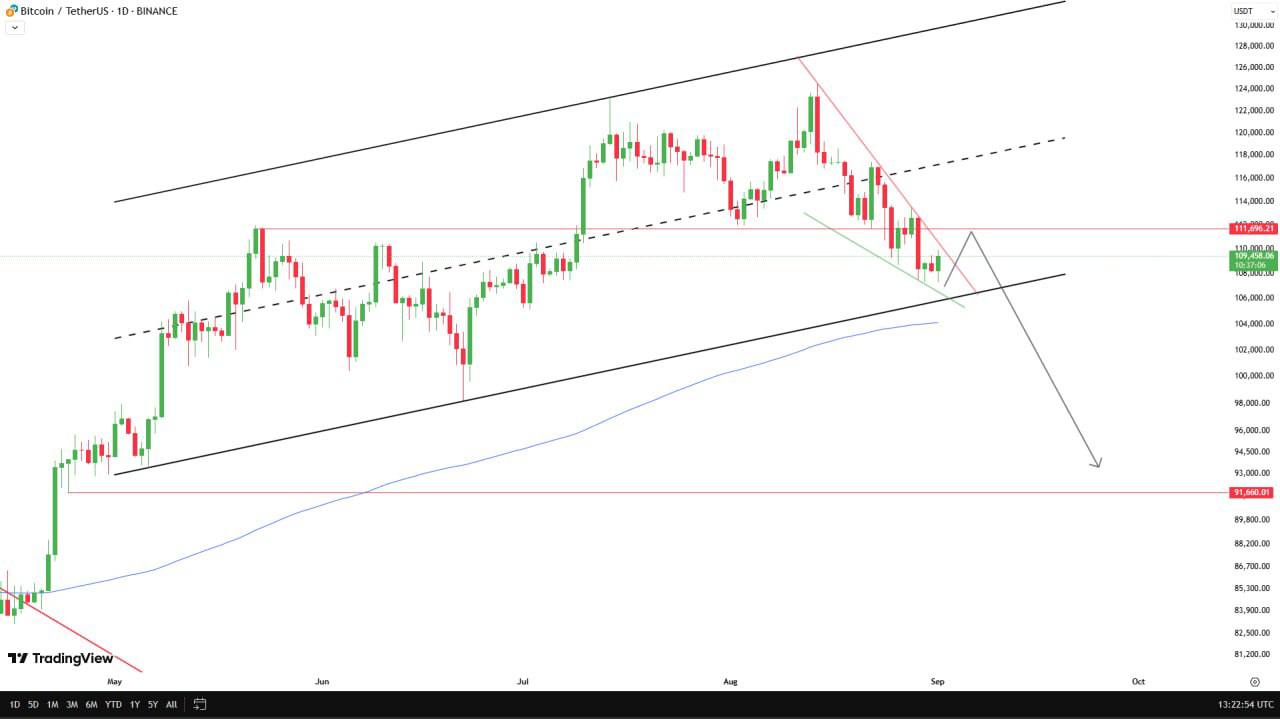
While Corvinus said that the next daily candles would decide the fate of a potential reversal, popular trader Roman dismissed the idea that one was already playing out.
“No immediate signs of reversal here as we have lost 112k support and are looking to turn it into new resistance,” he summarized, adding that he did not “see any reason we don’t see 100k support touch in the coming days.”
As Cointelegraph reported, Roman argued at the weekend that the loss of $100,000 would end the current bull market.
Bitcoin dips “100% of the time” in September week three
Returning to historical September performance, network economist Timothy Peterson had no good news for Bitcoin proponents.
Related: Bitcoin short-term holders spark rare BTC price bottom signal at $107K
September, he stressed, is synonymous with poor performance on BTC/USD, which has delivered average losses of 3.5% since 2013.
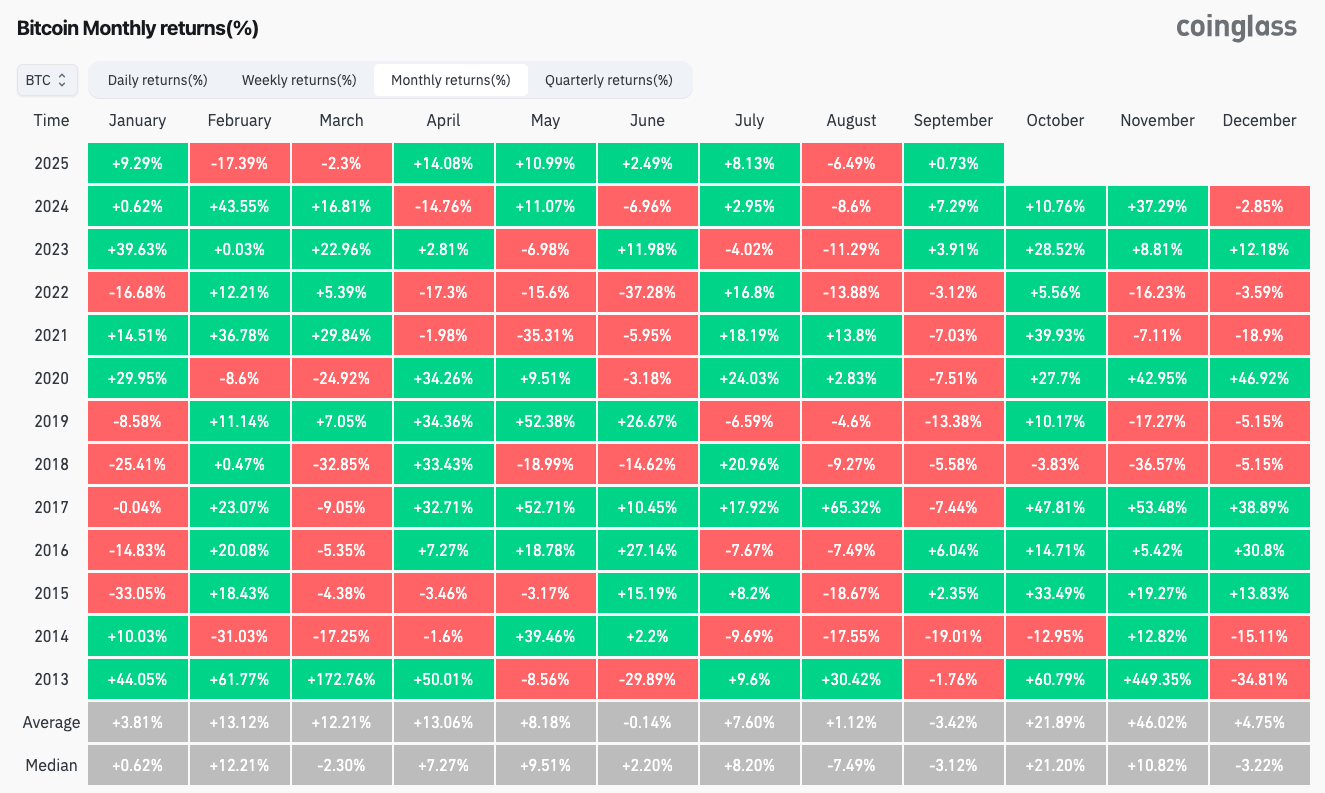
“The monthly average is deceiving. Volatility is very high,” Peterson noted.
“Between the 16th and the 23rd, Bitcoin dumps 100% of the time, with a typical decline of -5%.”
This article does not contain investment advice or recommendations. Every investment and trading move involves risk, and readers should conduct their own research when making a decision.


