Key points:
-
Bitcoin selling is mainly attributed to large sales by whales, not a chance in BTC’s market structure.
-
Despite the sharp market correction, Ether and BNB remain strong on the charts.
Bitcoin (BTC) bulls are defending the $110,530 support, but the bears have kept up the pressure. CoinShares reported $1 billion in net outflows from BTC exchange-traded products last week.
Investor interest seems to be shifting from BTC to Ether (ETH). Month-to-date ETH ETPs witnessed $2.5 billion in inflows, while BTC has seen $1 billion in outflows.
Data from crypto intelligence firm Arkham uploaded to X by analytics account Lookonchain showed that a whale entity deposited about 22,769 BTC ($2.59 billion) to Hyperliquid (HYPE) for sale and then purchased 472,920 $ETH ($2.22 billion) in spot and opened 135,265 $ETH ($577M) long position.
In contrast, Michael Saylor’s Strategy, the world’s largest public BTC holder, bought 3,081 BTC for $356.9 million, boosting the firm’s BTC holdings to 632,457 BTC, according to a US Securities and Exchange Commission filing on Monday.
Could buyers maintain BTC above its crucial support? Could ETH’s strength trigger an altcoin rally? Let’s analyze the charts of the top 10 cryptocurrencies to find out.
S&P 500 Index price prediction
The S&P 500 Index (SPX) turned up sharply from the 20-day exponential moving average (6,392) on Friday, signaling solid buying on dips.
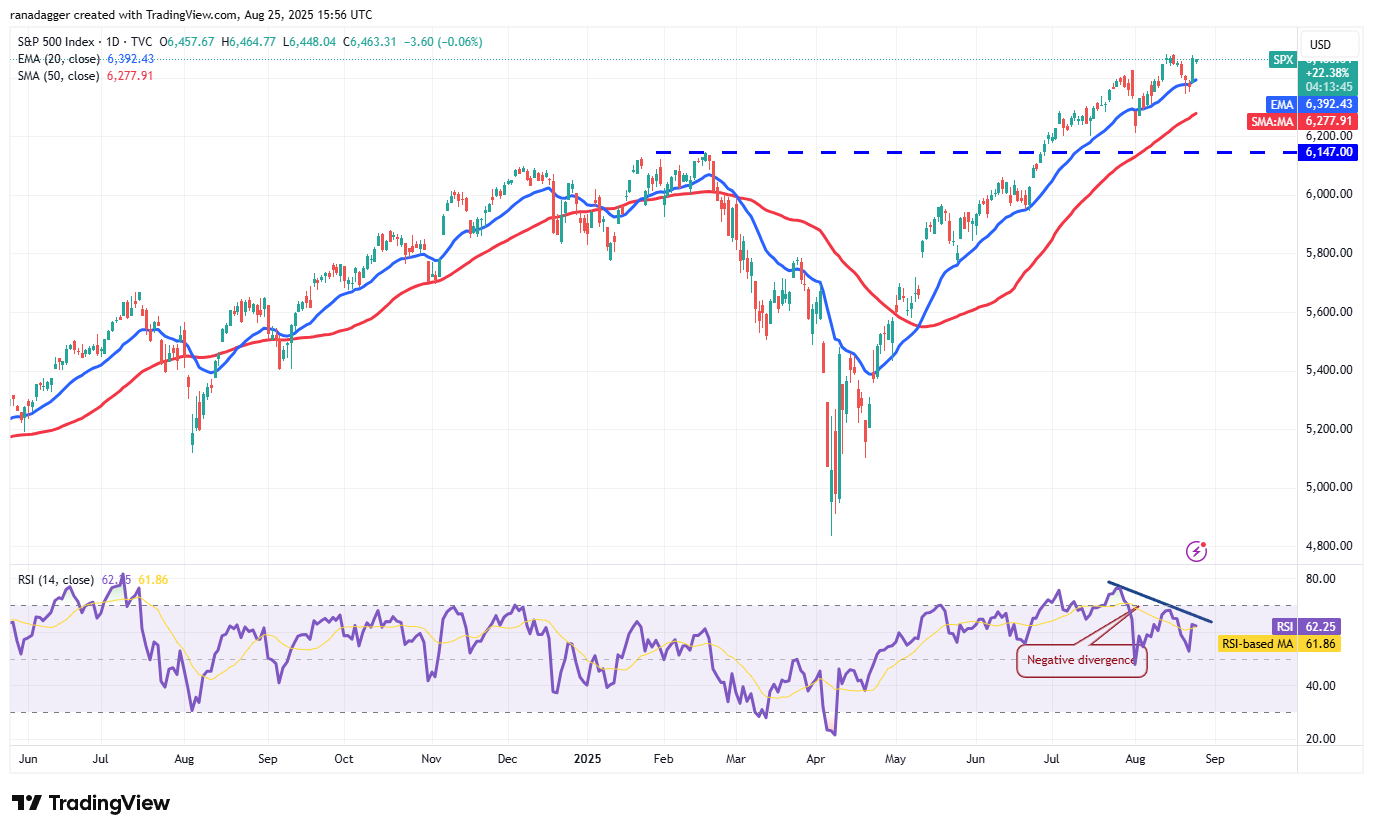
Buyers will try to strengthen their position further by pushing the price above 6,581. If they can pull it off, the index could rally to 6,696.
Although the trend remains up, the relative strength index (RSI) is flashing signs of a negative divergence. That suggests the bullish momentum is weakening. The bears will have to pull and retain the price below the 20-day EMA to accelerate selling. The index could then plunge to the breakout level of 6,147.
US Dollar Index price prediction
The US Dollar Index (DXY) rose above the moving averages on Thursday, but the higher levels attracted solid selling by the bears.
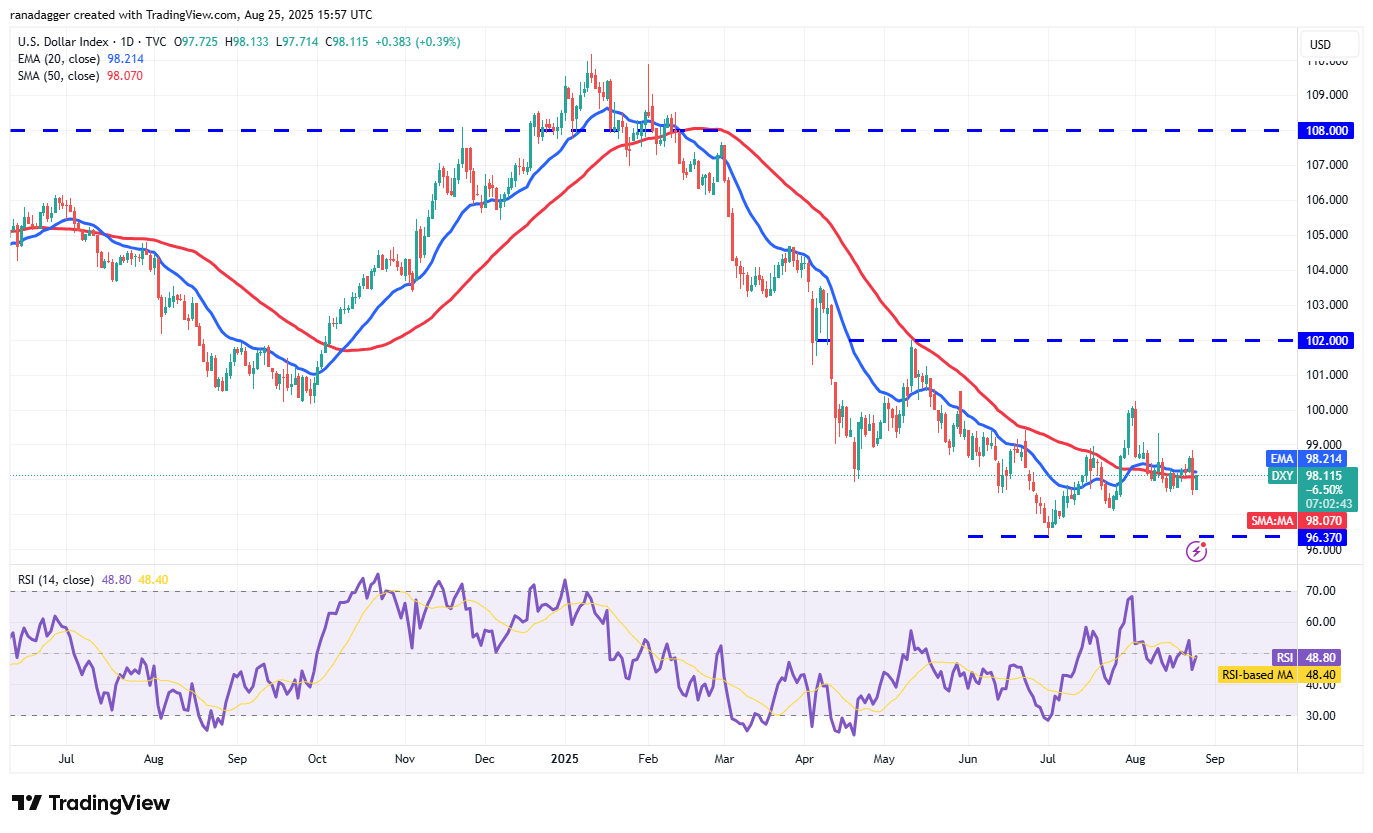
The moving averages are sloping down gradually, and the RSI is just below the midpoint, suggesting a minor advantage to the bears. If the price dips below 97.50, the next stop could be 97 and then 96.37.
Buyers will have to swiftly push the price back above the 99 level to signal strength. The index may then ascend to 100.50, where the bears are expected to step in. However, if buyers pierce the 100.50 resistance, the rally could extend to the 102 level.
Bitcoin price prediction
BTC fell near the critical support of $110,530 on Monday, but a minor positive is that the bulls held the level.
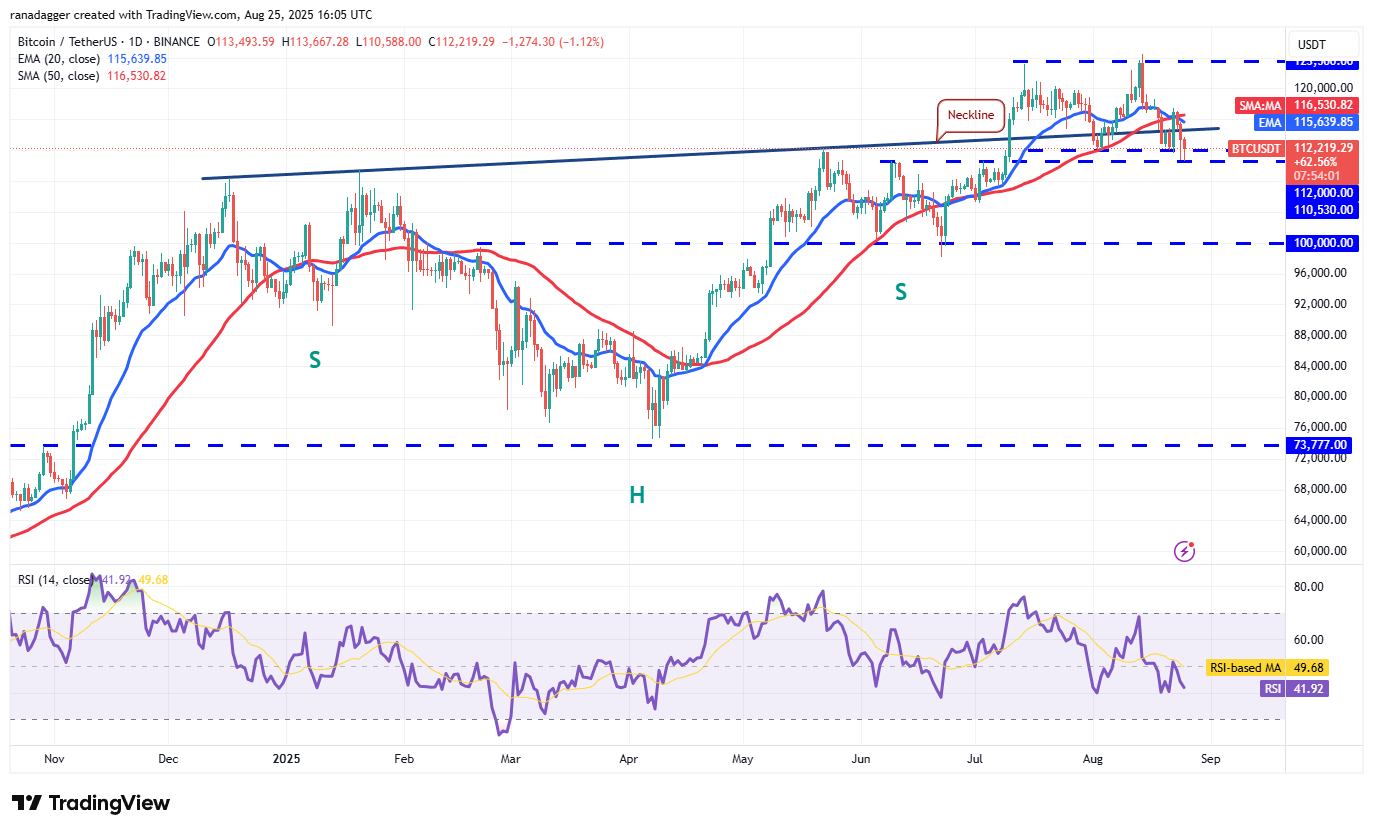
Any recovery attempt is likely to face strong selling at the 20-day EMA ($115,639). If the price turns down from the 20-day EMA, the risk of a break below the $110,530 support increases. If that happens, the BTC/USDT pair could tumble to $105 and then to the psychological level of $100,000.
Conversely, if the price breaks above $117,500, it suggests a potential range formation. Bitcoin’s price could then swing between $110,530 and $124,474 for a while.
Ether price prediction
ETH soared to a new all-time high of $4,956 on Sunday, but the bulls could not sustain the higher levels.
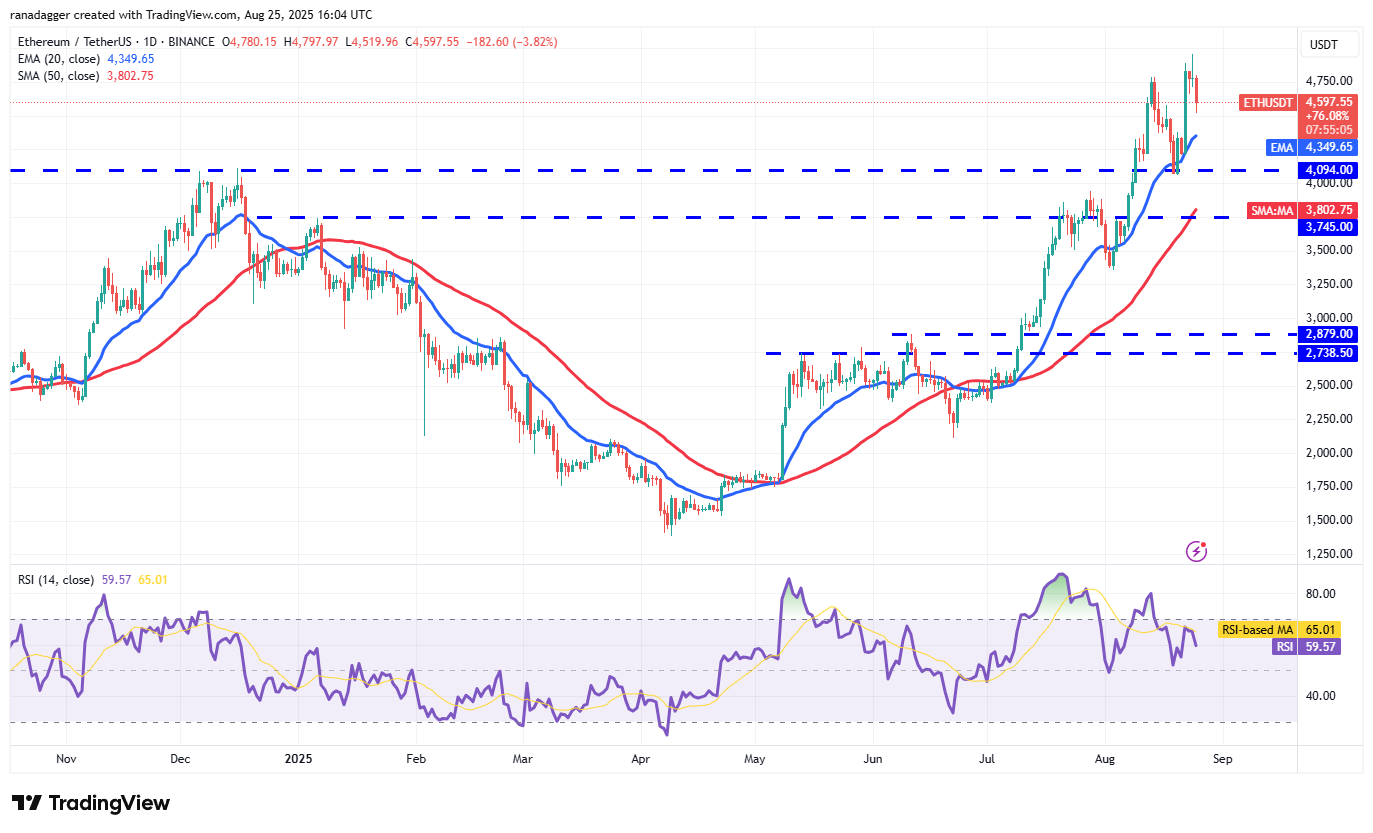
The price pulled back on Monday, suggesting profit booking by the short-term traders. The ETH/USDT pair could drop to the 20-day EMA ($4,349), which is a vital level to watch out for. If the price rebounds off the 20-day EMA with strength, the bulls will make one more attempt to propel the pair above $5,000. If they succeed, the Ether price could soar to $5,500.
On the contrary, a break below the 20-day EMA could sink the Ether price to the essential support at $4,060.
XRP price prediction
XRP (XRP) has formed a descending triangle pattern, which will complete on a break and close below $2.73.
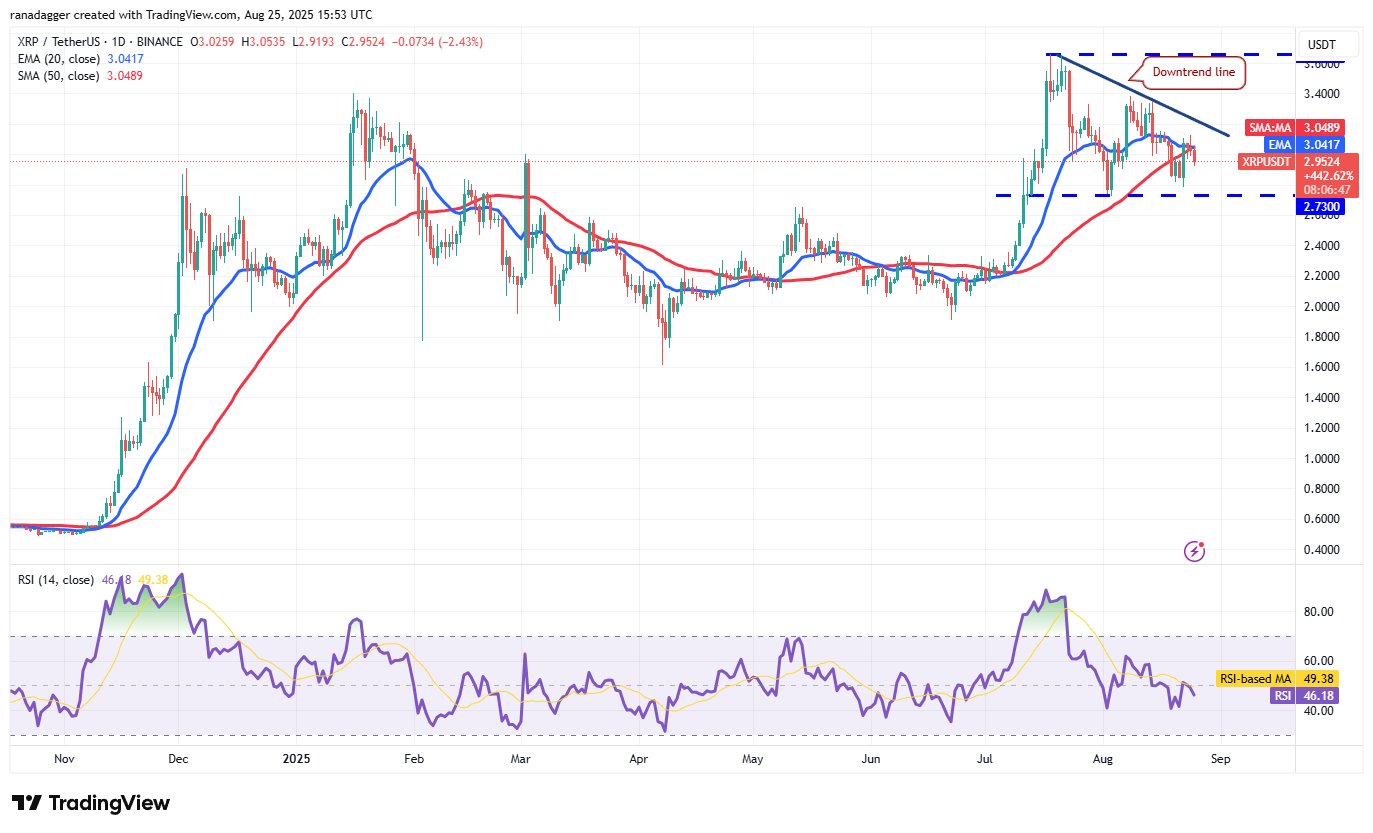
The slightly downsloping 20-day EMA ($3.04) and the RSI just below the midpoint do not give a clear advantage either to the bulls or the bears. If the price turns down from the 20-day EMA, the sellers will make one more attempt to sink the XRP price below $2.73. If they manage to do that, the pair could plummet to $2.33.
The bearish setup will be negated on a break and close above the downtrend line. The XRP price could then climb to $3.40 and subsequently to $3.66.
BNB price prediction
BNB (BNB) skyrocketed to a new all-time high on Friday, indicating that the bulls are firmly in control.
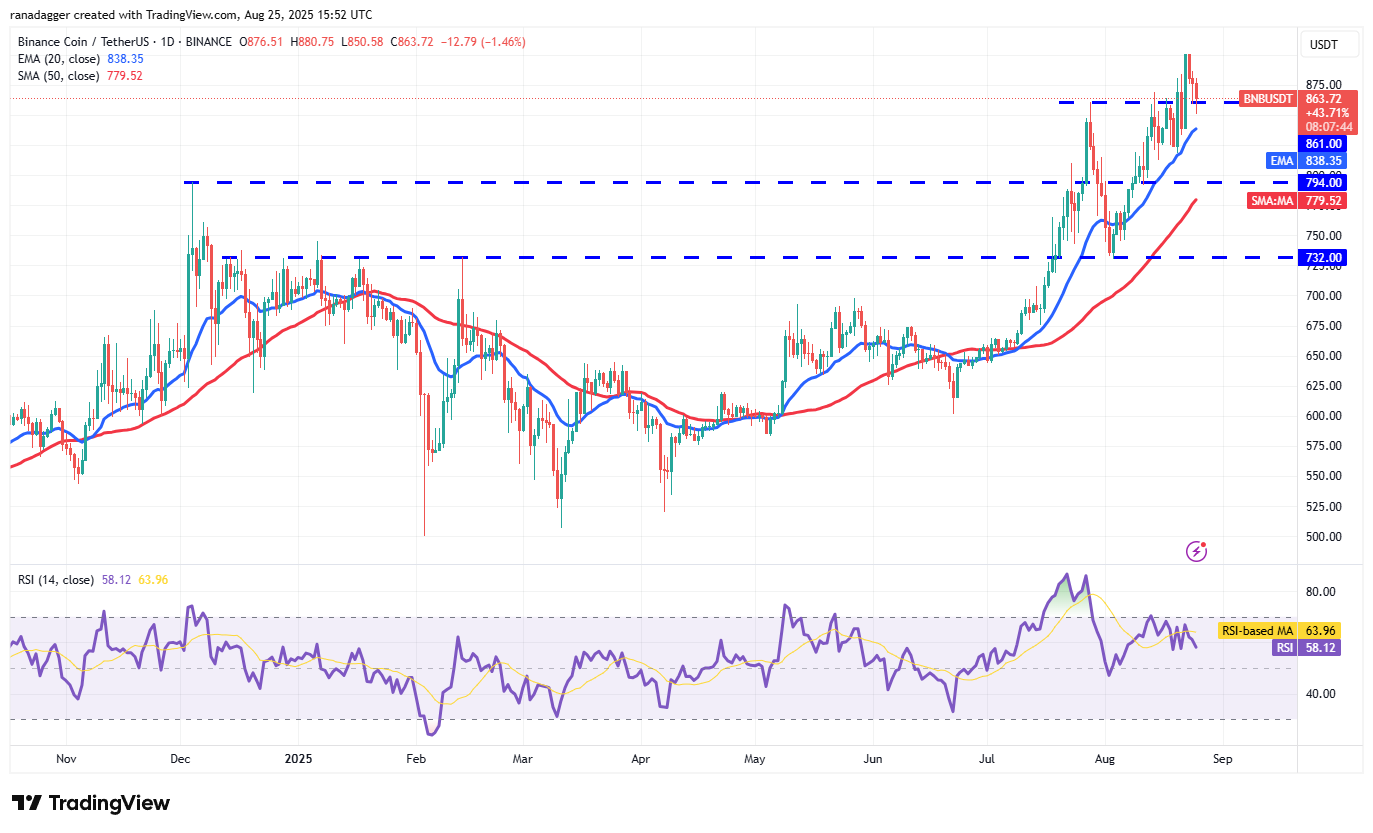
Profit booking near $900 pulled the price to the breakout level of $861, which is a critical level to watch out for. If the price turns up from $861 and breaks above $900, the BNB/USDT pair could soar toward $1,000.
Sellers will have to pull and maintain the BNB price below the 20-day EMA ($838) to weaken the bullish momentum. That could open the gates for a deeper correction to the 50-day SMA ($779).
Solana price prediction
Solana (SOL) is facing resistance at the $210 level, but a positive sign is that the bulls have not ceded much ground to the bears.
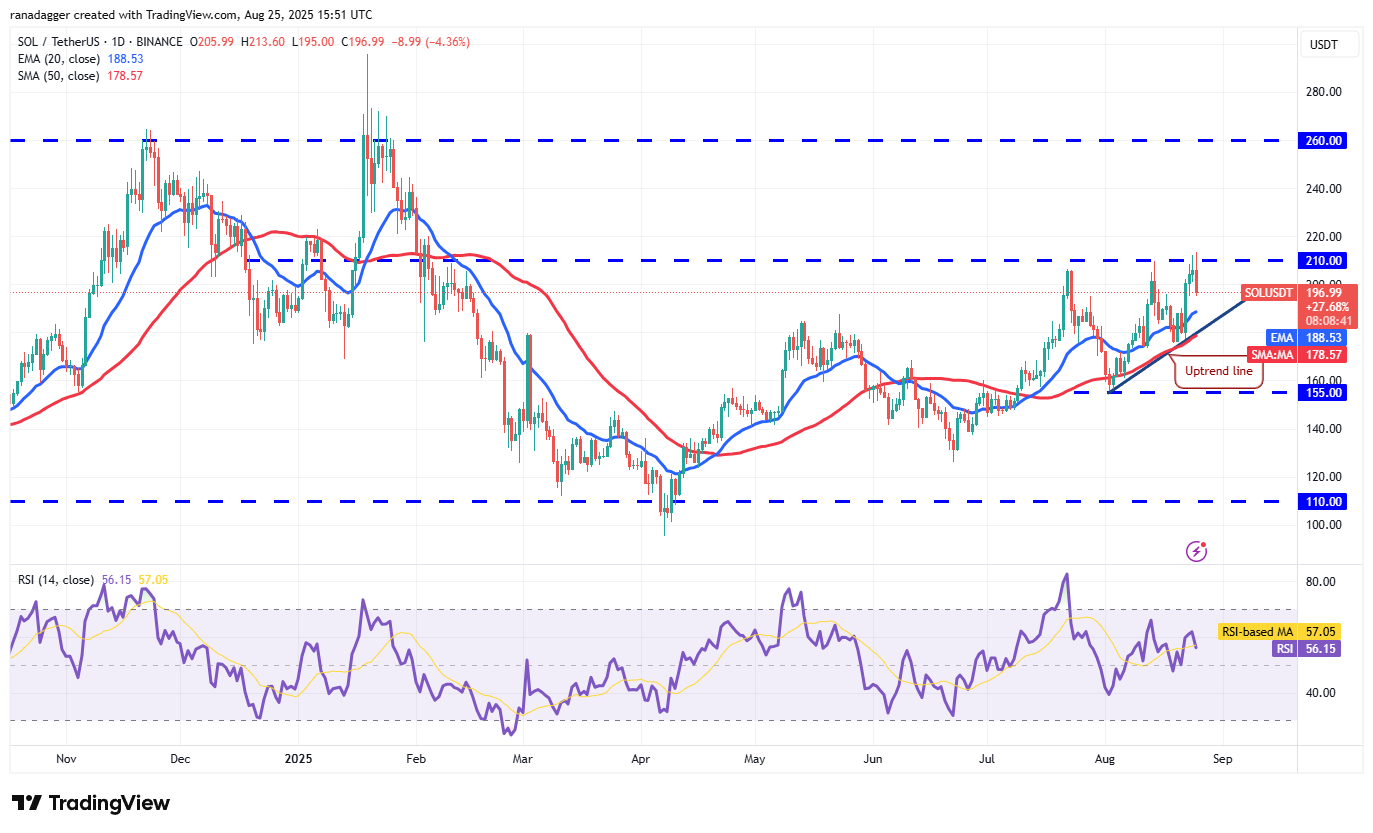
The SOL/USDT pair has formed an ascending triangle pattern, which will complete on a break and close above $210. If that happens, Solana’s price could start the next leg of the up move to $240 and then to the pattern target of $265.
This positive view will be invalidated in the near term if the price continues to fall and breaks below the uptrend line. The pair could then plummet to $155, where buyers are expected to step in.
Related: XRP price fails to overcome $3: Is a breakout still possible?
Dogecoin price prediction
Dogecoin (DOGE) turned up sharply from the $0.21 support on Friday and broke above the 20-day EMA ($0.22). However, the bulls could not sustain the higher levels.
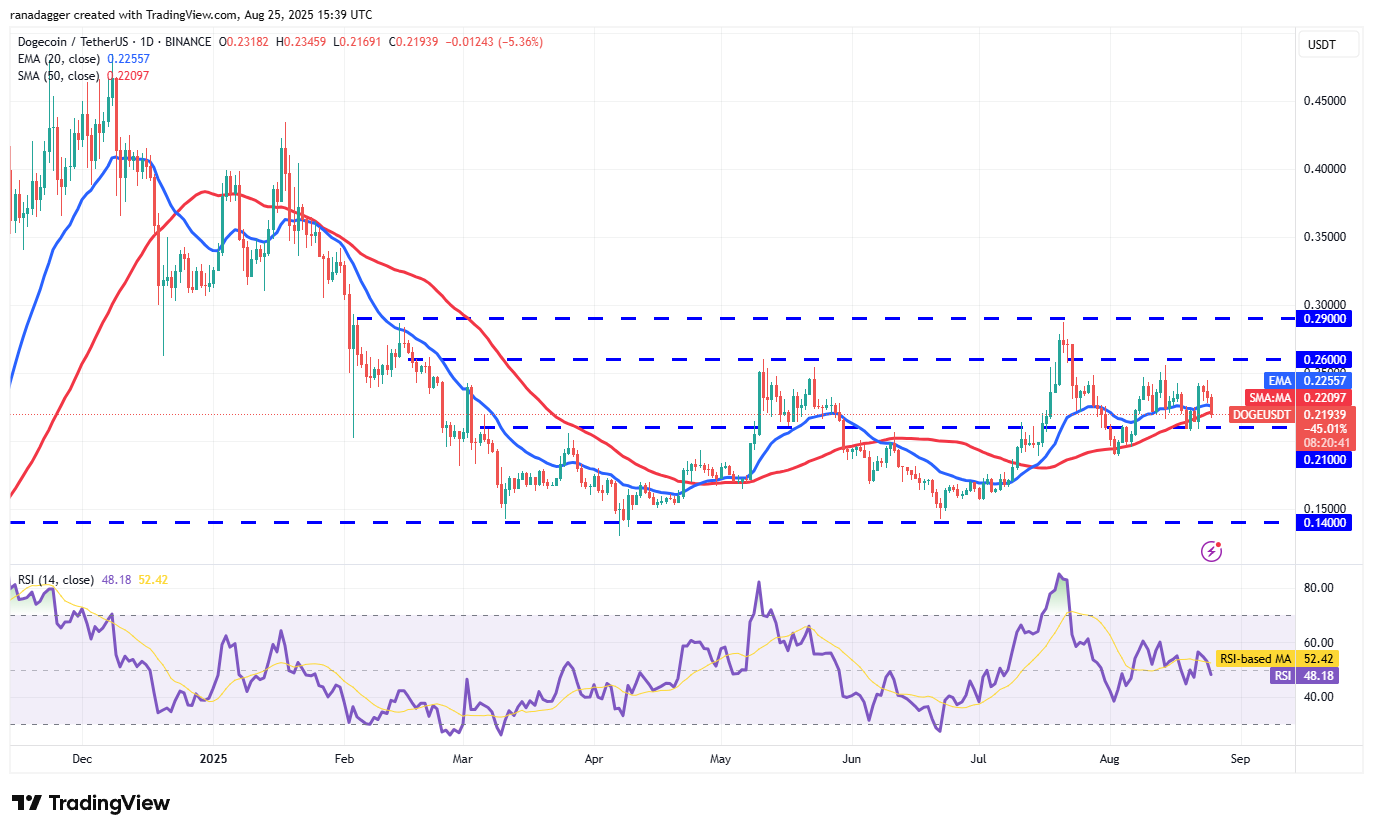
The flattish 20-day EMA and the RSI near the midpoint signal a balance between supply and demand. That could keep the DOGE/USDT pair inside the $0.21 and $0.26 range for a few more days.
The first sign of strength will be a break and close above $0.26. Dogecoin’s price may then climb to $0.29. A break and close above $0.29 opens the doors for a rally to $0.35. On the downside, a slide below $0.21 could sink the pair to $0.19 and then to $0.16.
Cardano price prediction
Cardano (ADA) bounced off the 20-day EMA ($0.86) on Friday, but the bulls are struggling to maintain the higher levels.
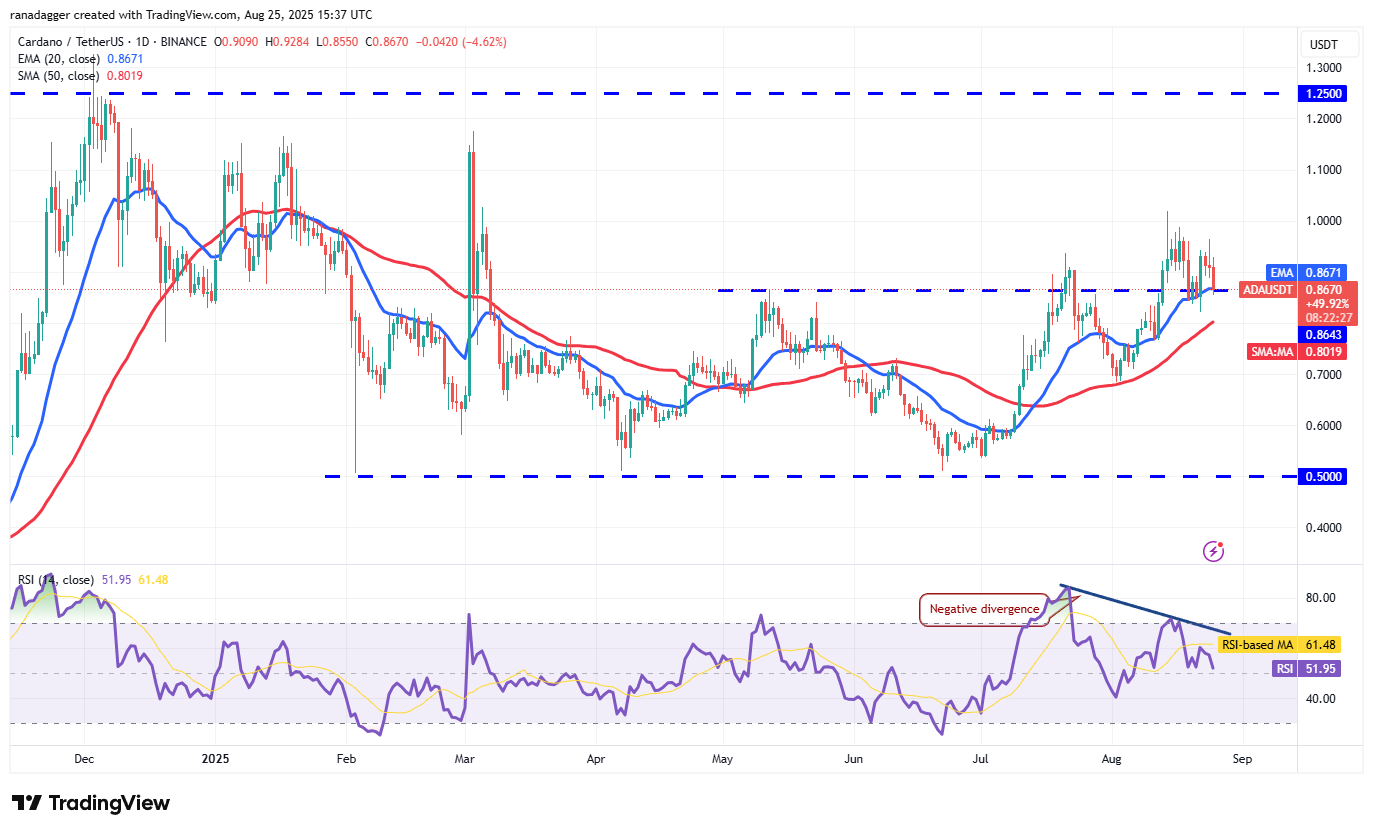
Both moving averages are sloping up, indicating an advantage to buyers, but the negative divergence on the RSI suggests the upside momentum is slowing down. If the price closes below the 20-day EMA, the risk of a drop below the 50-day SMA ($0.80) increases. The ADA/USDT pair may then slump to $0.70.
Buyers will have to drive the Cardano price above the $1.02 resistance to resume the up move toward $1.17.
Chainlink price prediction
Chainlink (LINK) turned down from $27 on Saturday, indicating that the bears are fiercely defending the level.
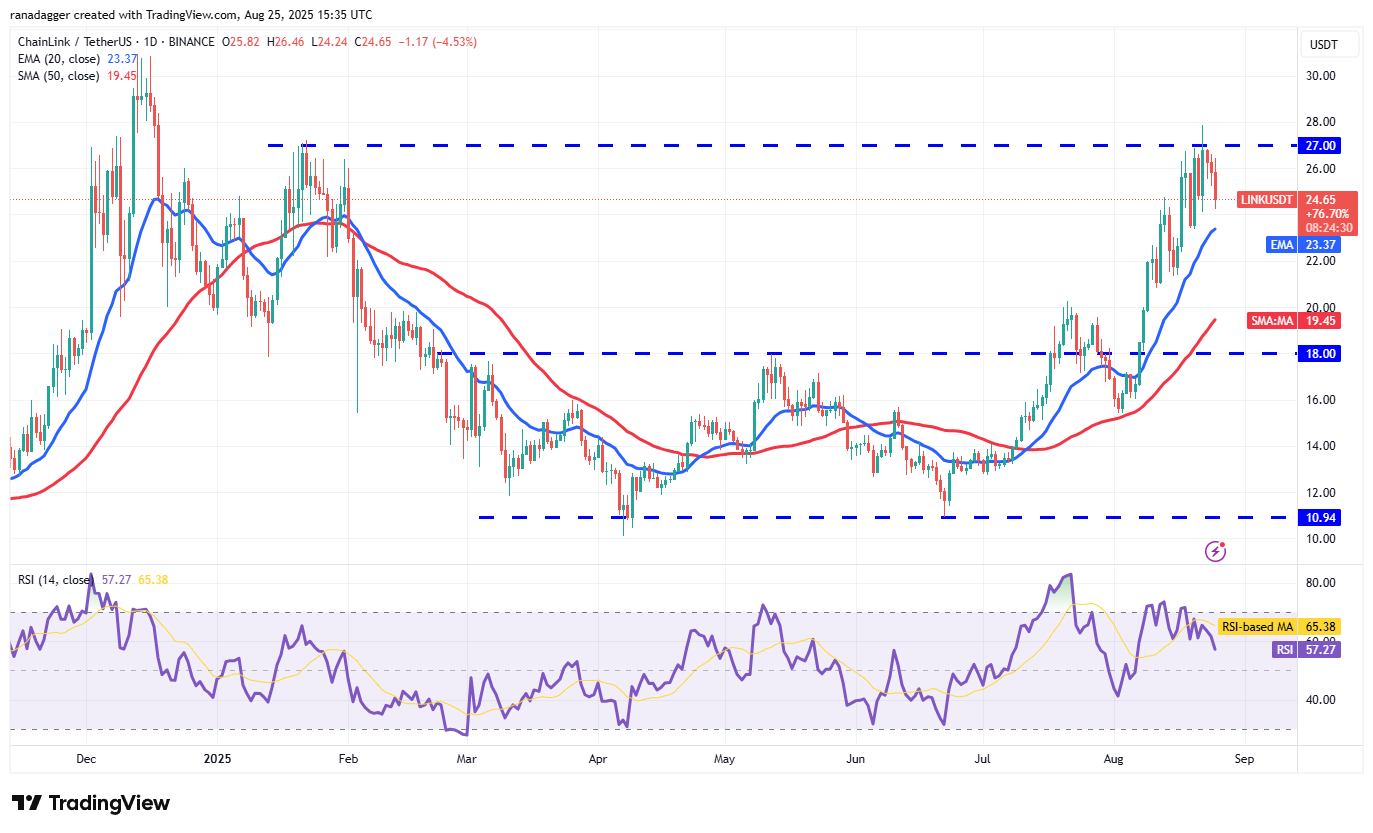
Sellers will try to pull the price to the 20-day EMA ($23.37), which is a crucial level to watch out for. If the LINK/USDT pair rebounds off the 20-day EMA with strength, the bulls will make one more attempt to clear the overhead hurdle. If they manage to do that, the Chainlink price could surge to $31.
Contrary to this assumption, a break and close below the 20-day EMA suggests the bulls are rushing to the exit. That could deepen the correction to $20.84.
This article does not contain investment advice or recommendations. Every investment and trading move involves risk, and readers should conduct their own research when making a decision.

