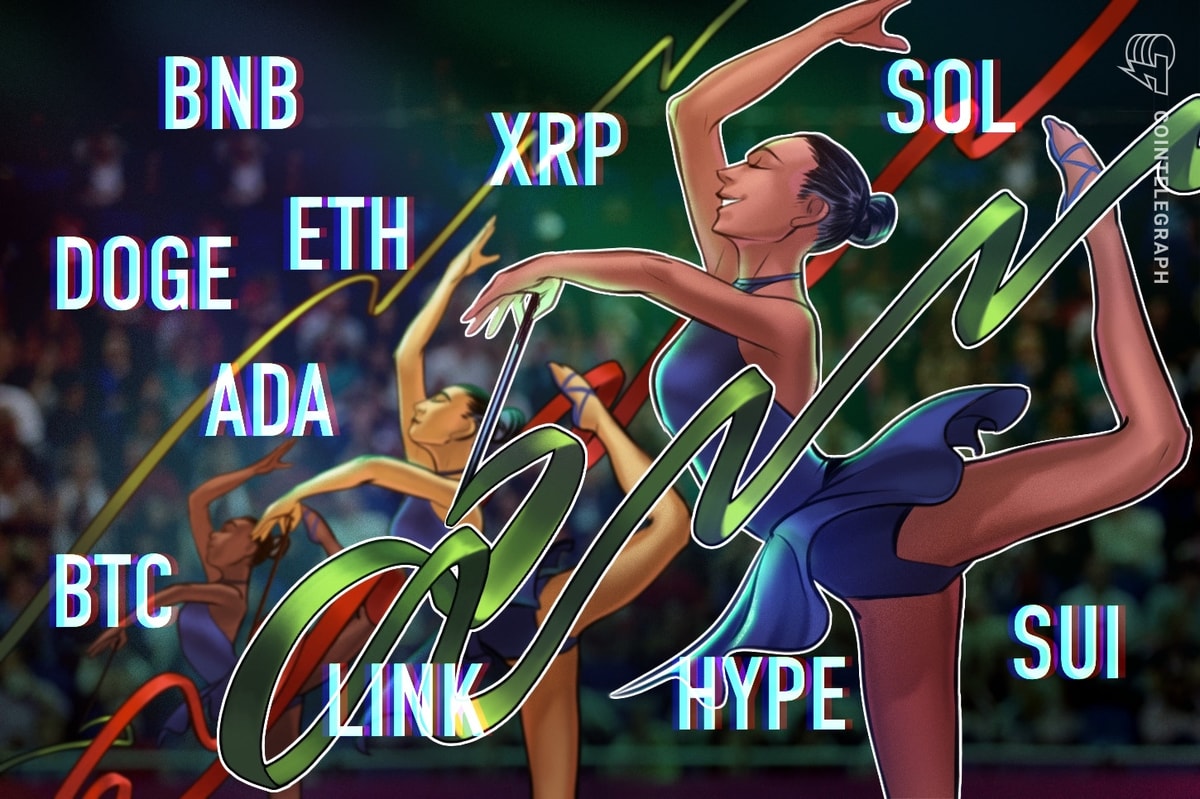

Key points:
-
Bitcoin rallied above $113,000 on Friday, but the long wick on the candlestick shows solid selling at higher levels.
-
Several major altcoins are trying to hold on to their support levels, but the bears have maintained their selling pressure.
Sellers pulled Bitcoin (BTC) below $110,000 on Thursday, but the bulls bought the dip and pushed the price above $113,000 on Friday. Higher levels attracted selling by the bears trying to pull the BTC price back below $110,000.
According to Glassnode’s latest The Week Onchain Report, BTC’s crucial level to watch on the upside is $116,000. If buyers pierce the $116,000 resistance, BTC could start the next leg of the uptrend. On the other hand, BTC risks falling to the $93,000 to $95,000 range if the $104,000 level cracks.
Alphractal founder and CEO Joao Wedson said in a post on X that BTC’s fractal cycle may end in October, but before that, a move to $140,000 is possible. If BTC tops out in October, it risks entering a bear market in 2026, which could pull the price below $50,000. Wedson added that he was eager to see if BTC’s four-year cycle had ended due to strong demand from exchange-traded funds and institutional investors, as some analysts claim.
What are the crucial support levels to watch out for in BTC and the major altcoins? Let’s analyze the charts of the top 10 cryptocurrencies to find out.
Bitcoin price prediction
BTC bulls pushed the price above the 20-day exponential moving average (EMA) ($112,093) but could not sustain the higher levels.
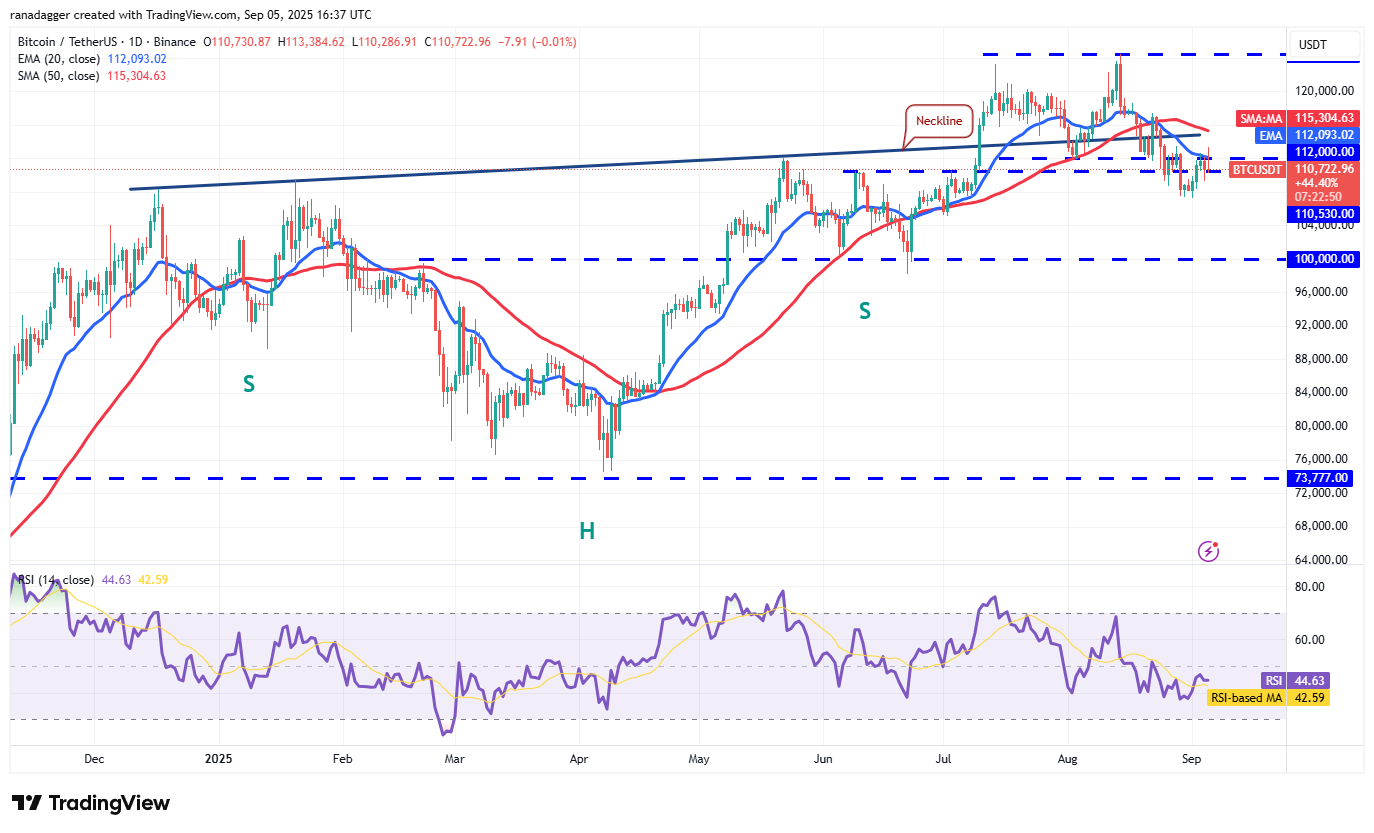
Sellers will have to swiftly tug the price below $109,000 to retain the advantage. The Bitcoin price may then descend to $107,250, a vital level to watch out for. If the support breaks down, the BTC/USDT pair may plunge to $105,000 and then to $100,000.
Buyers will have to push and sustain the price above the 20-day EMA to indicate strength. The pair may then climb to the 50-day simple moving average (SMA) ($115,304), which could attract sellers. If buyers overcome the sellers, the rally could reach $120,000 and eventually $124,474.
Ether price prediction
ETH (ETH) has been trading in a tight range between $4,500 and $4,250 for the past few days, indicating a balance between supply and demand.
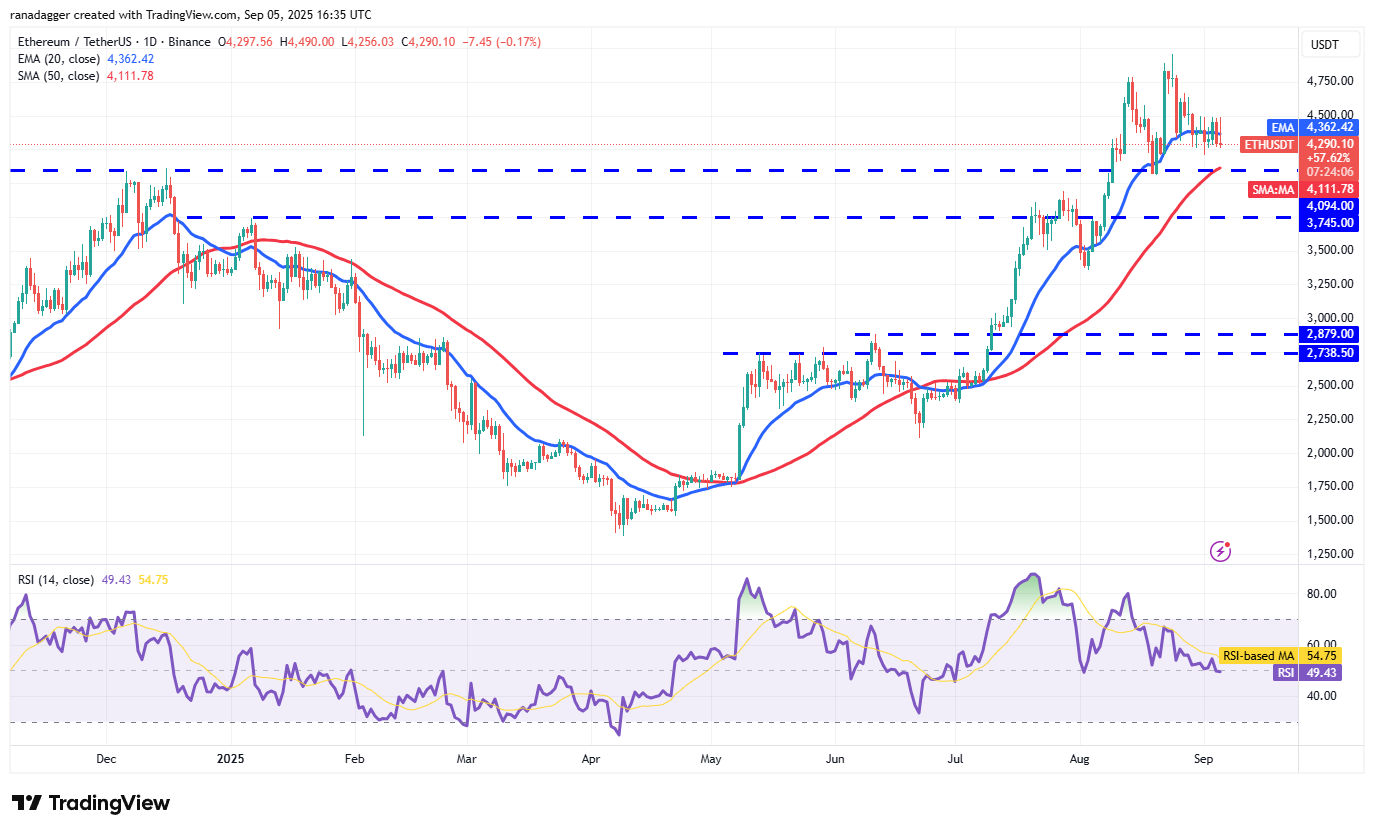
The flattish 20-day EMA and the RSI near the midpoint do not give a clear advantage either to the bulls or the bears. If the price rises above $4,500, it suggests the bulls are back in the game. The ETH/USDT pair may rally to $4,664 and then to $4,957.
Alternatively, if the price continues lower and slips below $4,250, the pair could dip to the breakout level of $4,094. Buyers are expected to vigorously defend the $4,094 level because a break below it may sink the Ether price to $3,745.
XRP price prediction
XRP (XRP) has formed a descending triangle pattern, which will complete on a break and close below $2.73.
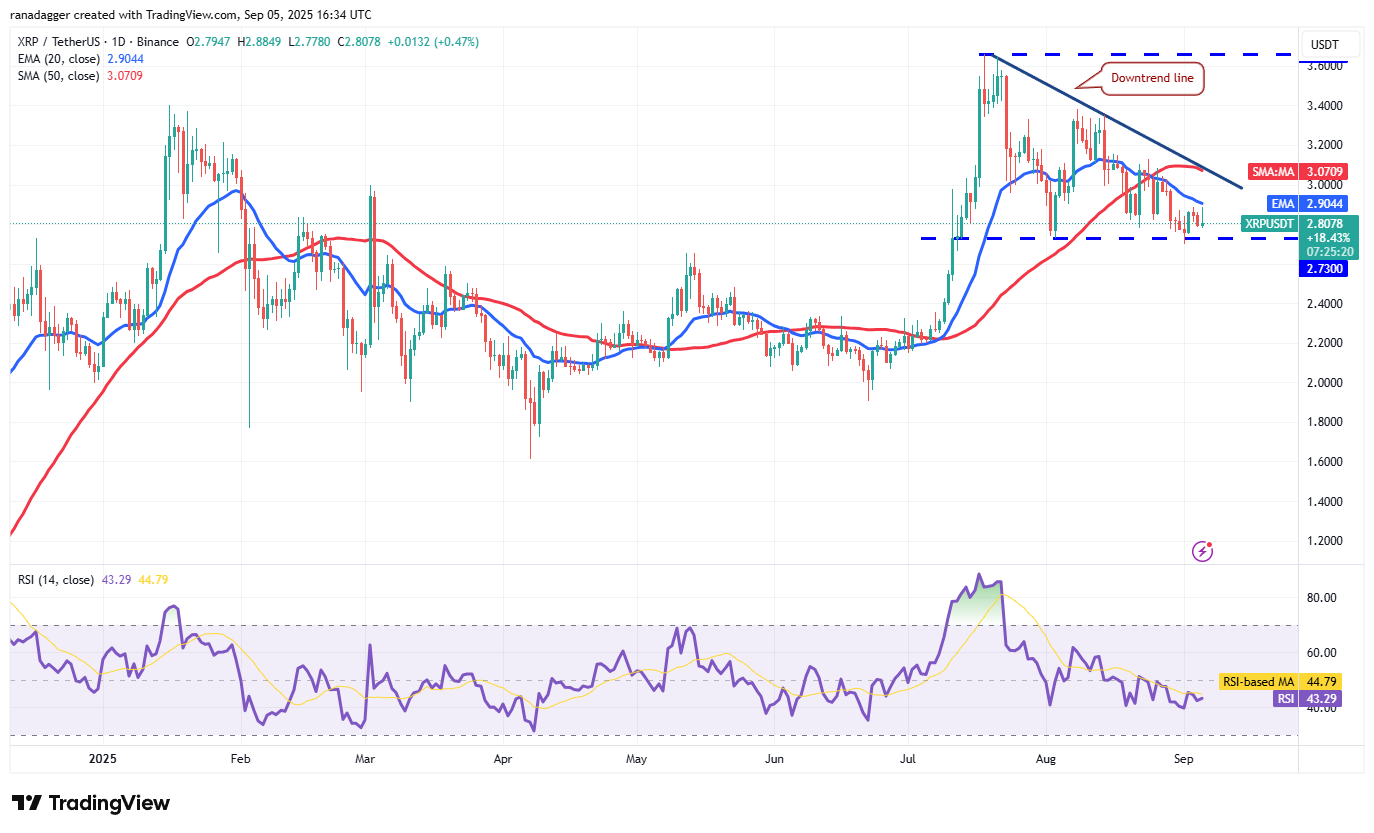
The downsloping 20-day EMA ($2.90) and the RSI just below the midpoint indicate an advantage to sellers. If the price turns down sharply from the 20-day EMA, the risk of a break below $2.73 increases. The XRP/USDT pair could then plummet toward $2.20.
Contrarily, a break above the 20-day EMA suggests the bears are losing their grip. The XRP price may then reach the downtrend line, where the bears are expected to mount a strong defense. A break and close above the downtrend line negates the bearish setup, clearing the path for a rally to $3.40 and then $3.66.
BNB price prediction
BNB (BNB) has been witnessing a tough battle between the bulls and the bears at the 20-day EMA ($848).
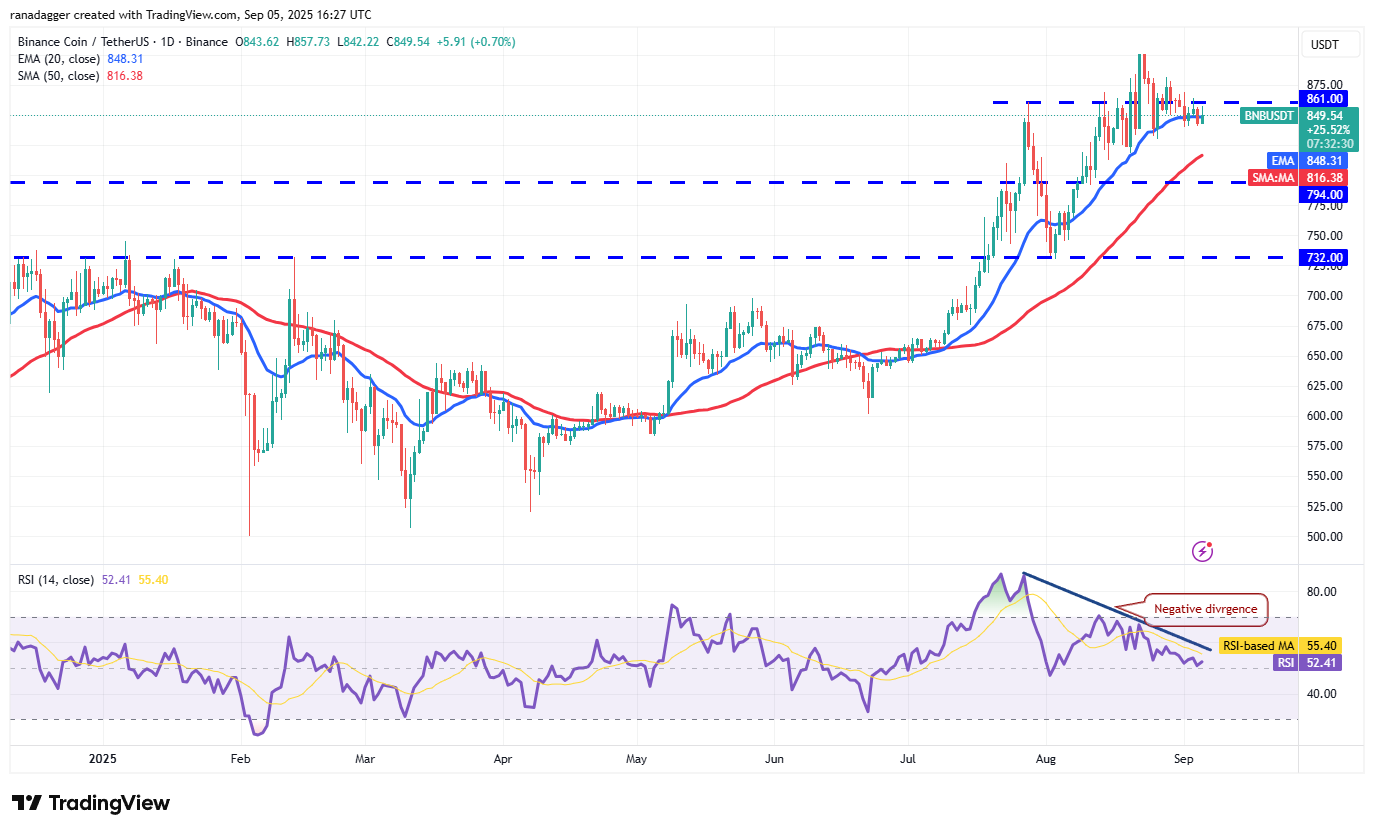
The flattish 20-day EMA and the RSI just above the midpoint do not give a clear advantage either to the bulls or the bears. If the price skids below $840, the next stop could be the 50-day SMA ($816). Buyers will try to stall the pullback in the zone between the 50-day SMA and the $794 level.
The first sign of strength on the upside will be a break and close above $881. That suggests the bulls are back in the driver’s seat. The BNB price could pick up momentum above $900 and rally to $1,000.
Solana price prediction
Solana (SOL) turned down from the $210 level on Thursday but is taking support at the 20-day EMA ($198).
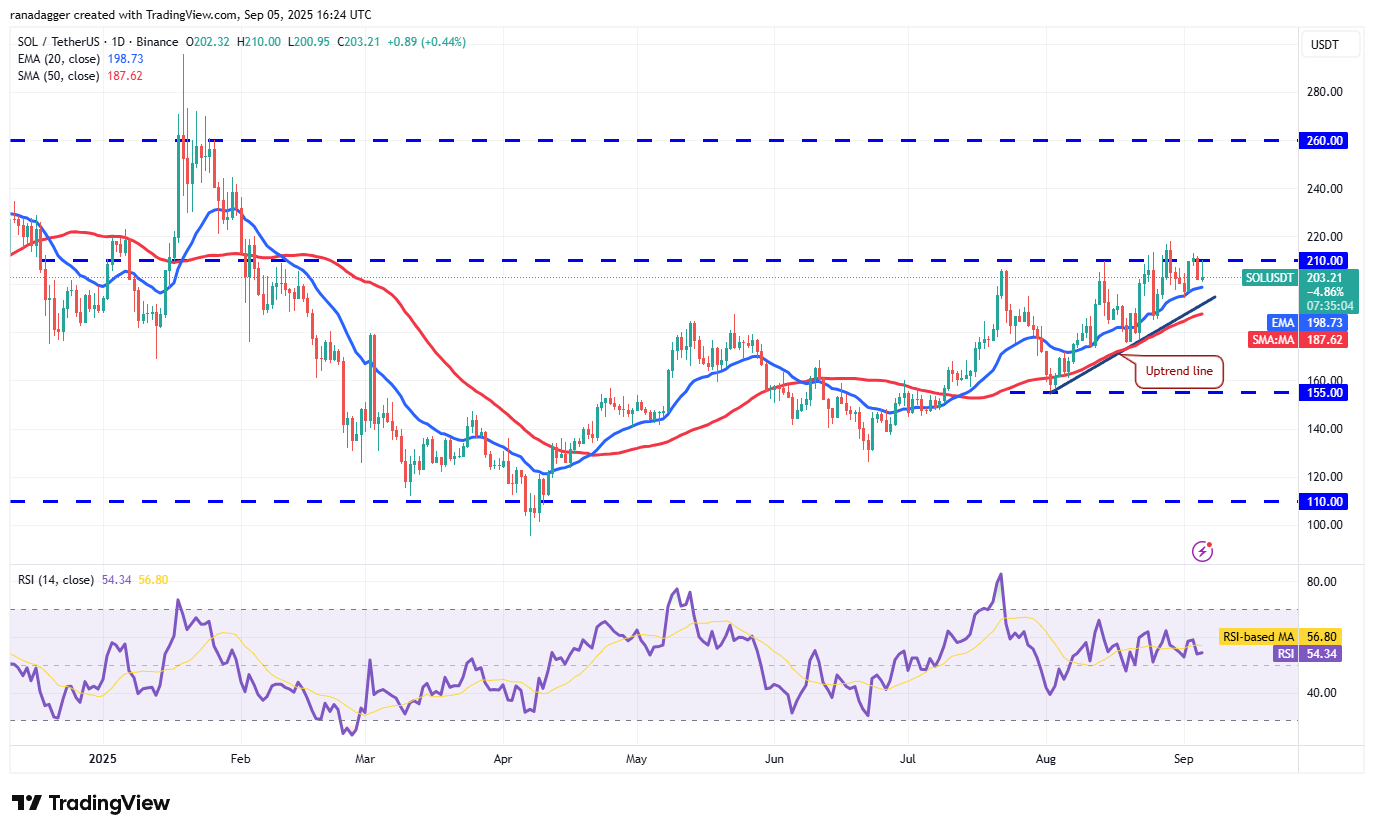
The bulls will try to seize control by pushing the price above the $218 resistance. If they can pull it off, the SOL/USDT pair will complete a bullish ascending triangle pattern, starting the next leg of the up move to $240 and eventually to $260.
Sellers will have to yank the price below the uptrend line to invalidate the bullish setup. The pair may fall to $175 and then to $155, where buyers are expected to step in. That could keep the Solana price inside the $155 to $218 range for a few days.
Dogecoin price prediction
Dogecoin (DOGE) has been trading between the moving averages and the $0.21 support for a few days.
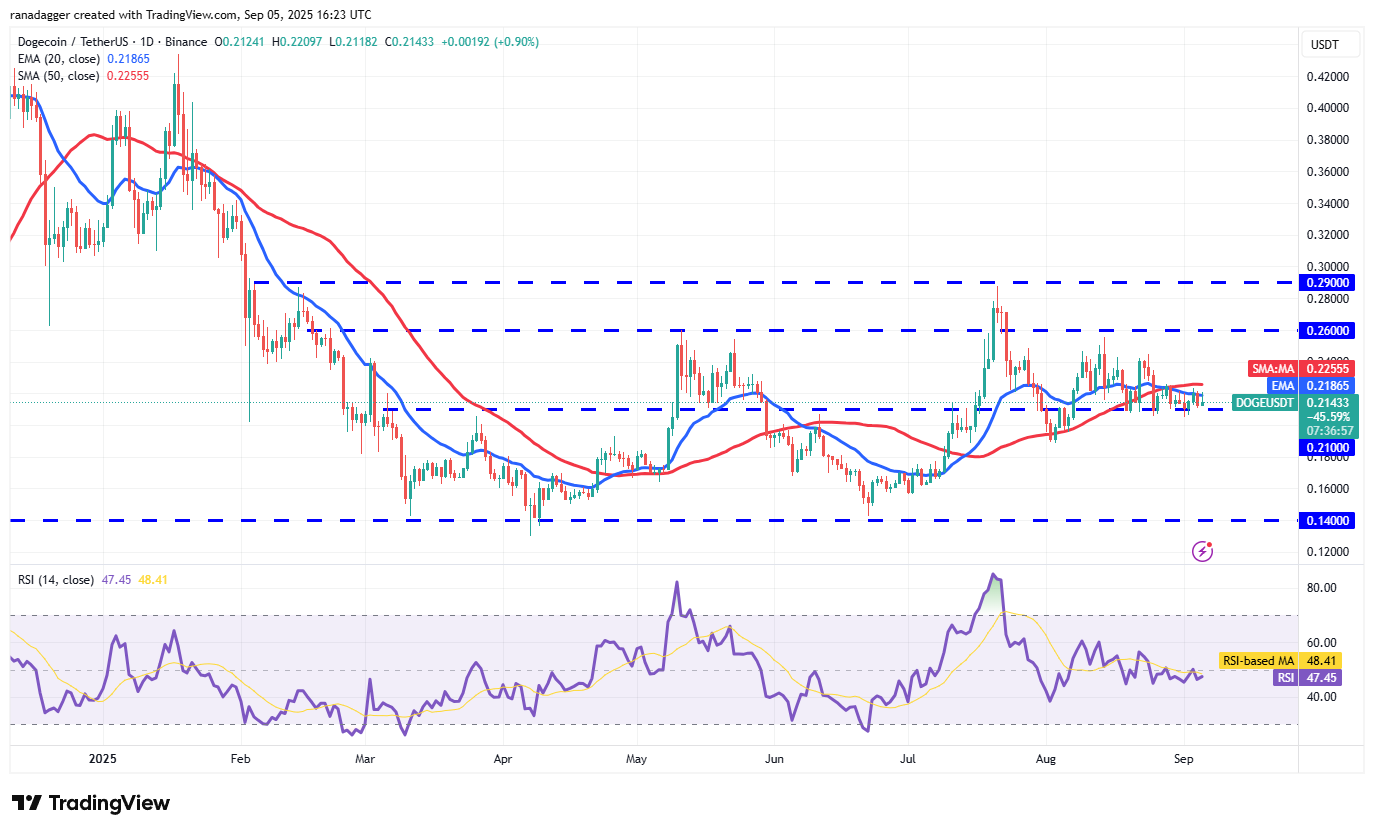
The gradually downsloping 20-day EMA ($0.21) and the RSI just below the midpoint give a slight advantage to the bears. A break and close below $0.21 tilts the advantage in favor of the bears. The DOGE/USDT pair may then drop to $0.19, bringing the large $0.14 to $0.29 range into play.
Buyers will have to drive the Dogecoin price above the 50-day SMA ($0.22) to gain strength. The pair may then march toward $0.26.
Cardano price prediction
Buyers tried to push Cardano (ADA) above the 20-day EMA ($0.84) on Friday, but the bears held their ground.
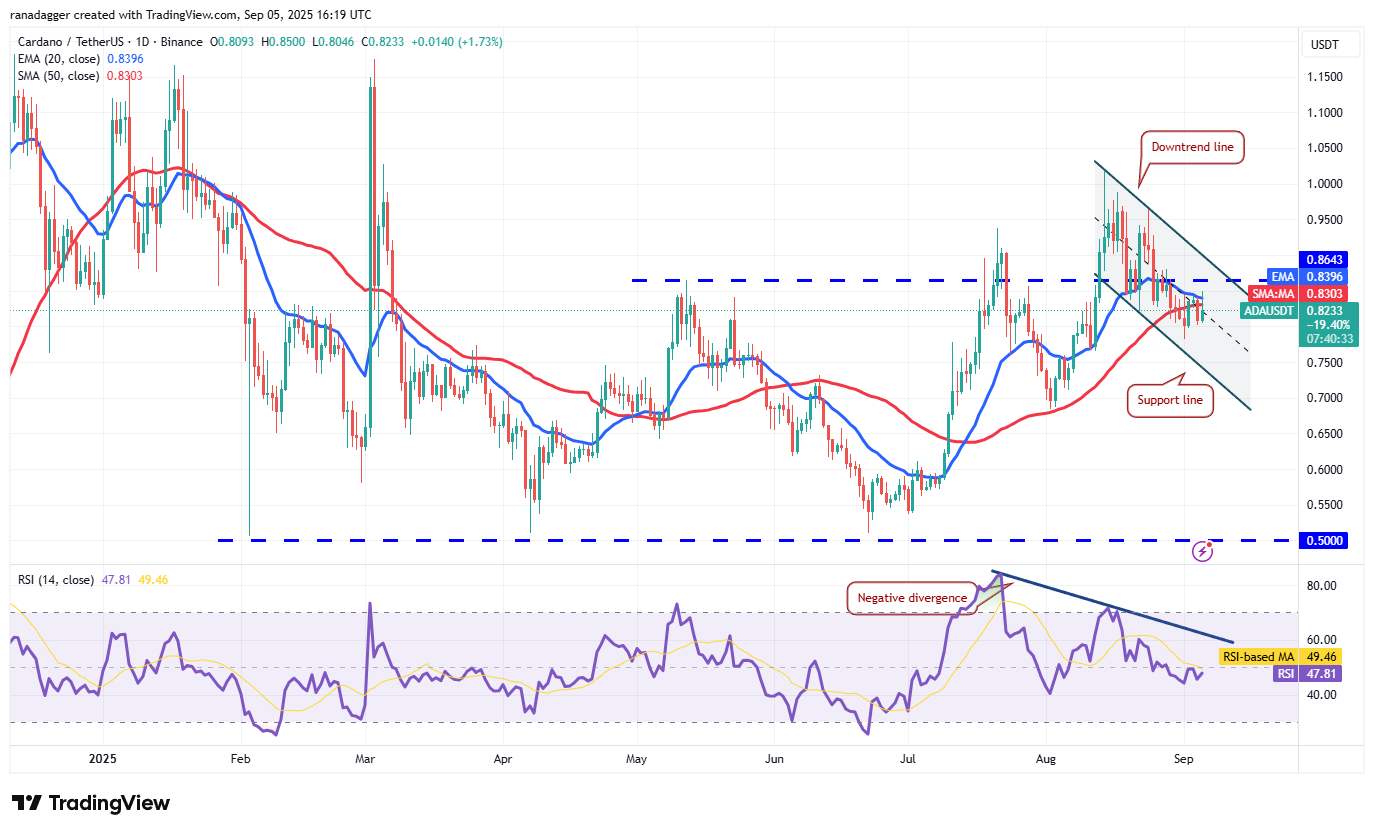
There is support at $0.80, but if the level gives way, the ADA/USDT pair could tumble to the support line of the descending channel pattern. A bounce off the support line is expected to face selling at the 20-day EMA. If that happens, the likelihood of a break below the support line increases. The Cardano price may then descend to $0.68.
Contrarily, a close above the 20-day EMA suggests that the selling pressure is reducing. The pair may then reach the downtrend line. Buyers will have to pierce the downtrend line to signal the start of a new up move to $1.02.
Related: Bitcoin price ignores major US payrolls miss to erase $113.4K surge
Chainlink price prediction
Chainlink (LINK) turned down from the 20-day EMA ($23.24) on Thursday, signaling that the bears are aggressively defending the level.
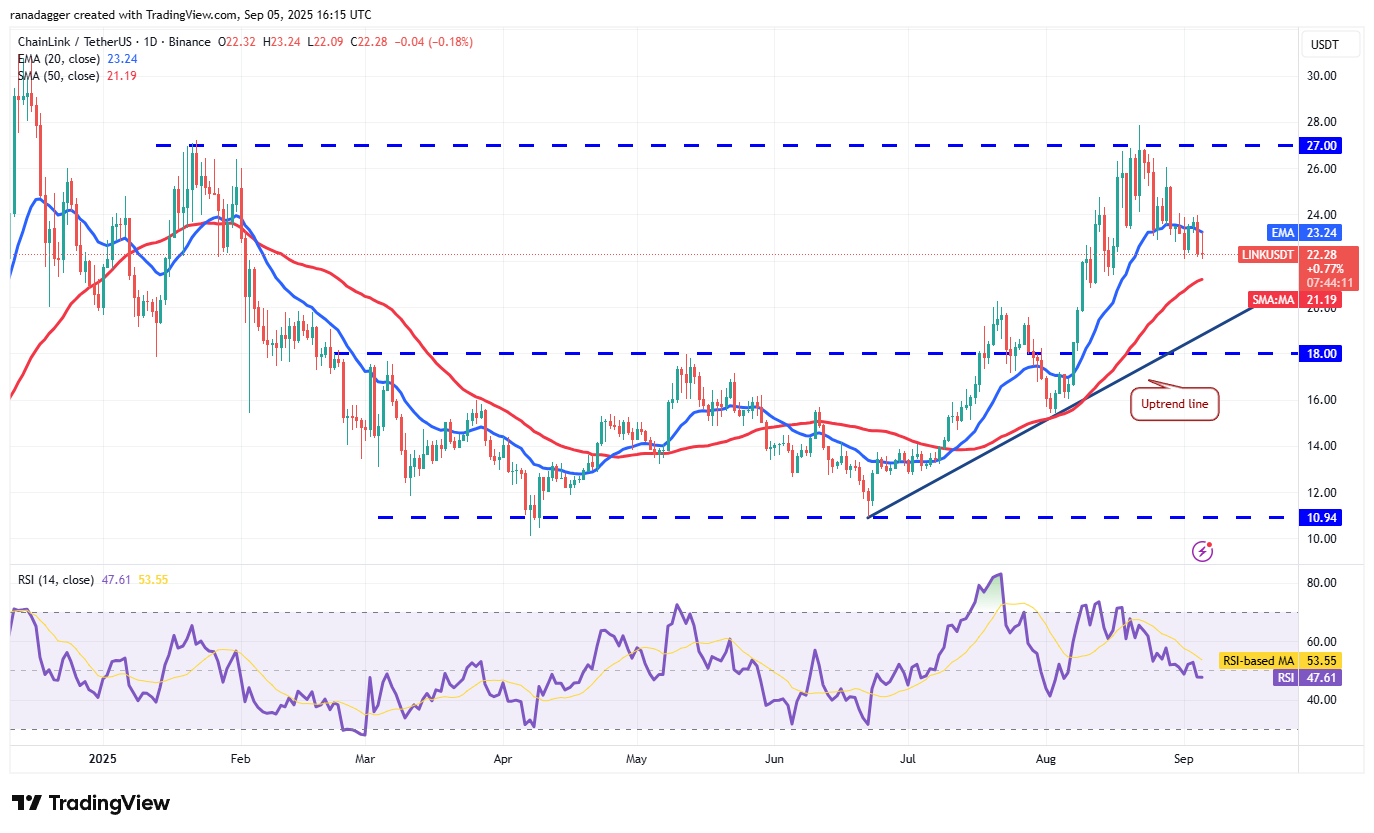
Sellers will try to pull the price to the 50-day SMA ($21.19), which is likely to act as strong support. If the price rebounds off the 50-day SMA and breaks above $24.10, it suggests that the bears are losing their grip. The LINK/USDT pair may then climb to $26 and subsequently to $28.
Contrary to this assumption, a break and close below the 50-day SMA could sink the Chainlink price to the uptrend line.
Hyperliquid price prediction
Hyperliquid (HYPE) bounced off the 20-day EMA ($44.78) on Friday, indicating solid buying by the bulls.
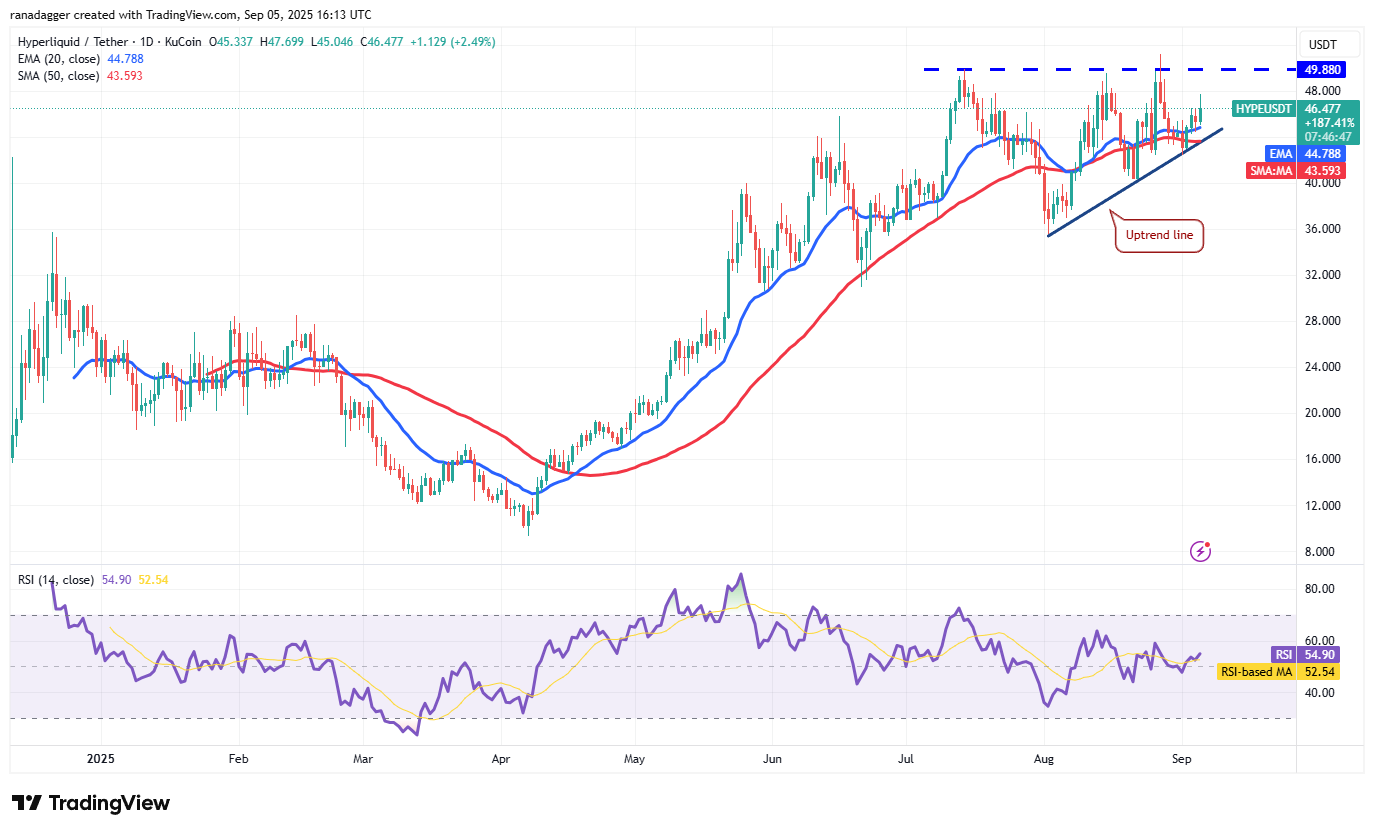
If buyers maintain the price above $46.50, the HYPE/USDT pair could rally to the $49.88 to $51.19 overhead resistance zone. Sellers are expected to defend the resistance zone with all their might because a close above it completes a bullish ascending triangle pattern. The Hyperliquid price may then surge toward the pattern target of $64.25.
This positive view will be invalidated in the near term if the price turns down and breaks below the uptrend line. The pair may slump to $40 and then to $35.51.
Sui price prediction
Sui (SUI) turned down from the 20-day EMA ($3.43) on Thursday, but the bulls are trying to form a support at $3.26.
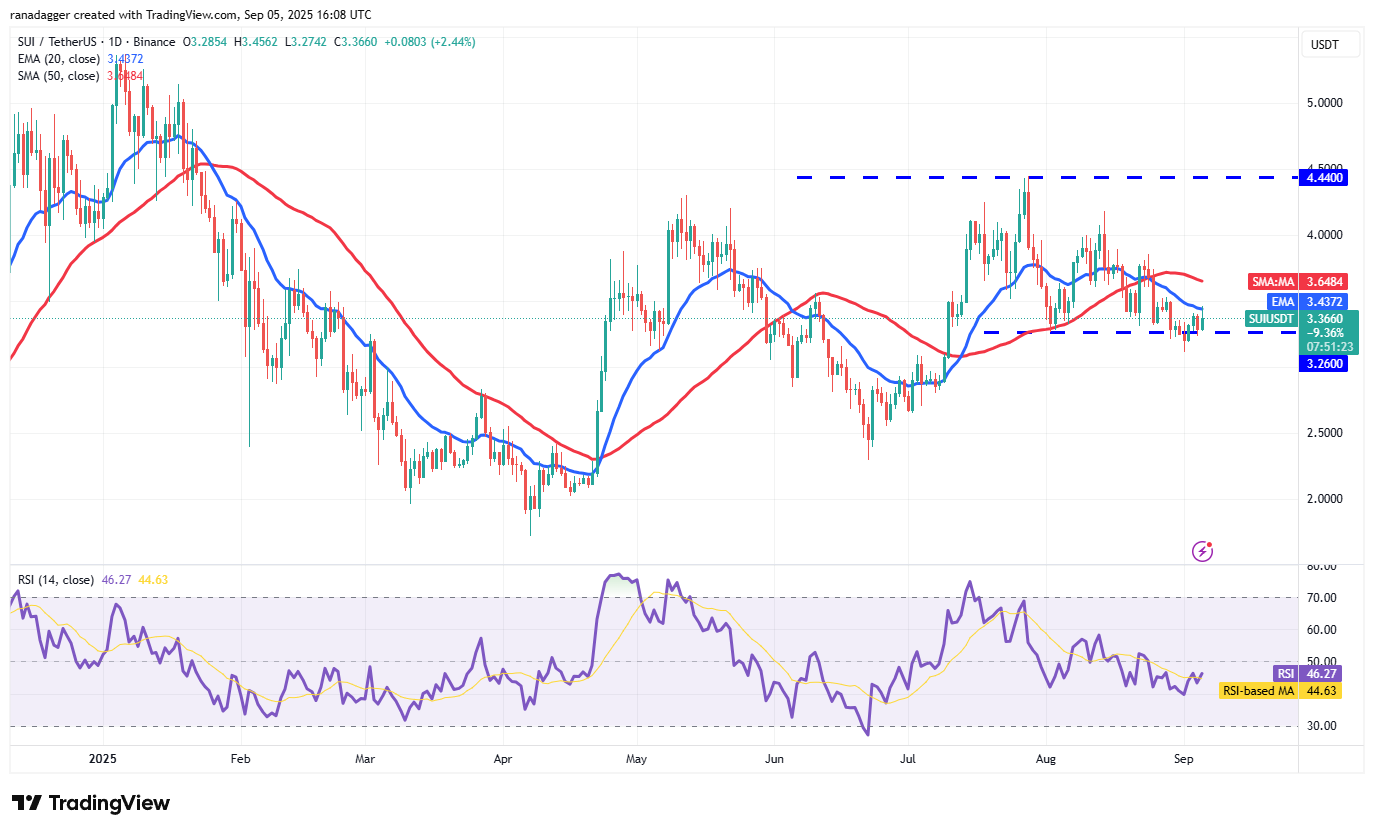
The bulls will strive to strengthen their position by pushing Sui’s price above the 20-day EMA. If they do that, the SUI/USDT pair could rally to the 50-day SMA ($3.64). This is a crucial level to watch out for because a break above the 50-day SMA suggests the price may swing between $3.26 and $4.44 for some more time.
The bears will have to tug the price below the $3.11 level to gain the upper hand. The pair may then slump to $2.80.
This article does not contain investment advice or recommendations. Every investment and trading move involves risk, and readers should conduct their own research when making a decision.


