

Key point:
-
BTC’s rally above $109,000 has invalidated a bearish pattern, setting the stage for bulls to make a run at a new all-time high.
Bitcoin (BTC) rallied sharply on Wednesday and is trying to continue its uptrend on Thursday, indicating sustained demand from the bulls. 10x Research head of research Markus Thielen told Cointelegraph that Bitcoin could surge to $116,000, supported by strong inflows into the spot Bitcoin exchange-traded funds, US Federal Reserve uncertainty and the sharp drop in Bitcoin supply on crypto exchanges.
Could Bitcoin soar and maintain above the all-time high, or will the price turn lower, trapping the aggressive bulls? Let’s analyze the charts to find out.
Bitcoin price prediction
Bitcoin bounced off the $105,000 support and closed above the downtrend line on Wednesday. That invalidated the bearish descending triangle pattern, which is a positive sign.
Both moving averages are sloping up, and the relative strength index (RSI) is in the positive territory, indicating an advantage to buyers. The BTC/USDT pair could reach the neckline of the inverse head-and-shoulders pattern, where the bears are expected to step in. If the bulls do not give up much ground from the neckline, it increases the likelihood of a break above it. The pair may then rally toward the pattern target of $150,000.
Sellers will have to swiftly pull the price below the moving averages to prevent the upside. The pair may then slump to $105,000 and subsequently to $100,000.
Related: Bitcoin price rallied 80% the last time BTC funding rates flipped red
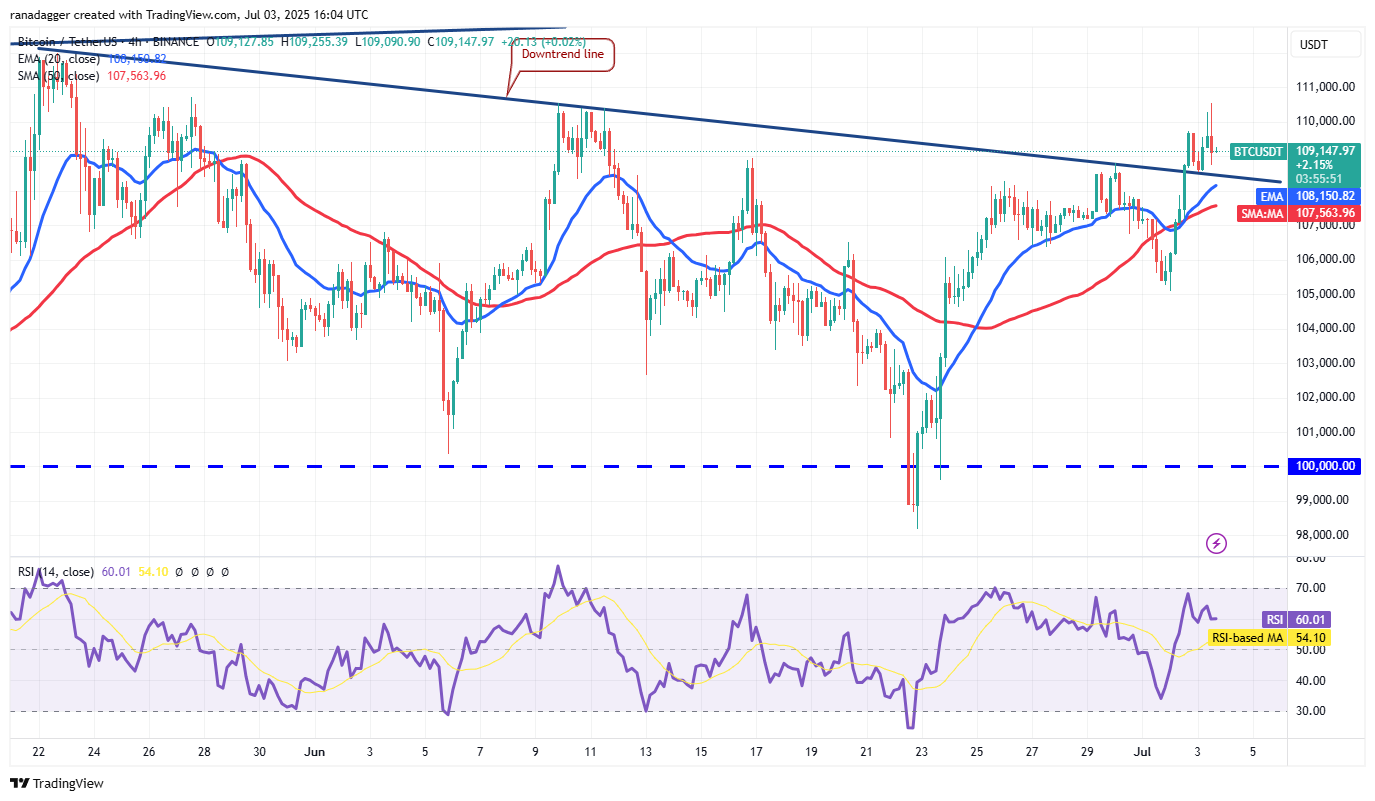
The price broke above the downtrend line and successfully retested the breakout level, signaling that the bulls are trying to flip the level into support. The upsloping moving averages and the RSI in the positive zone signal that bulls have the edge.
However, the bears are unlikely to give up easily. They will try to fiercely defend the zone between $110,500 and $111,980. If the price turns down from the overhead zone but finds support at the moving averages, it signals a positive sentiment. That increases the likelihood of a break above $111,980.
Sellers will be back in the driver’s seat if the price turns down and plummets below the moving averages.
This article does not contain investment advice or recommendations. Every investment and trading move involves risk, and readers should conduct their own research when making a decision.


