

The invention of market cap-weighted indices has been beneficial for the average investor by providing a simple and efficient way to gain exposure to equity markets. However, hidden beneath the surface of some market cap-weighted indices lies levels of concentration rarely observed in history.
In this post, we examine how elevated concentration levels have historically impacted returns, valuations, and long-term investor outcomes — and why today’s market dynamics may be setting the stage for a familiar ending.
The US stock market has reached its highest concentration level in more than 50 years, with the top 10 stocks comprising a weighting of 36%. Several problems may arise when a few companies dominate the market.
The concentration in the top 10 stocks necessitates that performance will be heavily influenced by these handful of companies. Strong performance from these stocks can drive the entire market higher, while any significant declines may disproportionately drag the market down. This dynamic can sometimes mask the performance of the remaining 490 stocks, leading to a skewed perception of overall market health.
While there is always an urge to proclaim, “this time is different,” market history tells us that while the plot may change, the story often ends the same. In this post, we utilize the top 500 US stocks, weighted by market cap (Top 500), to examine how the top 10 stocks have historically performed based on levels of concentration and valuations, and why market participants may be unprepared for the aftermath of current events.
A stock’s placement in the top 10 may be short-lived and volatile or it may last for decades (Figure 1). The 1970s and 1980s were dominated by industrial giants and energy companies. IBM and Exxon Mobil spent multiple decades in the top 10. The 1980s and 1990s also saw a few pharmaceutical and telecommunications stocks enter and exit the top 10. Even tobacco producer Altria made a brief appearance in the top 10.
By 1999, the rise of technology/growth companies was in full swing as the weight to the top 10 stocks rose to multi-decade highs. The 1998 to 2000 Technology/Growth Bubble was the last great cycle of market concentration prior to our current extreme levels. The 2000s saw a decade of strong performance by value names as several energy and financial companies rose to the top 10. This came to a crashing halt during the 2008 financial crisis. The 2010s to present saw a resurgence of technology or technology-related companies that increased the level of market concentration beyond that of the late 1990s and early 2000s.
Figure 1: Largest Stocks Change Frequently Decade to Decade.
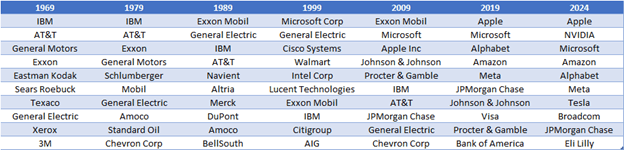
Represents the top 10 largest stocks based on market cap from the 500 largest US stocks. Source: Compustat. Calculation: Hartford Equity Modeling Platform.
Market Cap Weight vs. Earnings Contribution
The weight of the top 10 stocks is currently 37% and has increased at a far higher rate than their earnings contribution, which currently stands at only 28%. This has created a large gap between their earnings contribution and weight (Figure 2).
The current gap between the market cap weight and the earnings weight is one of the widest since 1970. There have been two other occasions of a gap close to this magnitude.
- In August of 2020, a gap appeared as the largest stocks led the way after the Covid bear market, ahead of the expected earnings that were projected following the “stay at home” shift in spending. In this case the weight to the top 10 remained steady as the market continued to rally and earnings contributions caught up.
- In 2000, the weight to the top 10 also remained steady and earnings contributions caught up, but in this instance company earnings had collapsed, and the market lost 49%.
It is impossible to predict how the current gap will be resolved, but the recent gap formed due to the weight of the top 10 going parabolic while their earnings contribution has remained steady. It would take a herculean effort for earnings contribution to catch up, but it is possible.
Figure 2: Weight to Top 10 Has Increased While Earnings Contribution Has Been Steady.
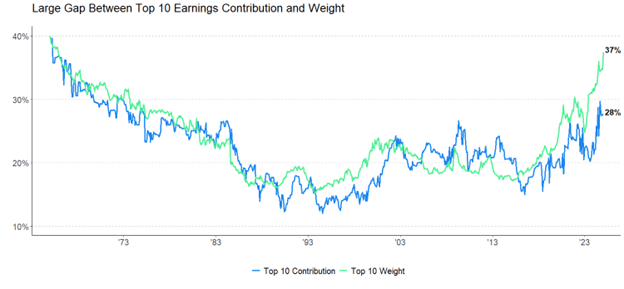
Date Range: 12/31/1964 to 12/31/2024. Represents the top 10 stocks based on market cap from the largest 500 US stocks. Source: Compustat. Calculation: Hartford Equity Modeling Platform.
Is it possible for today’s top 10 stocks to maintain their market leadership? Figure 3 is a hypothetical illustration of the growth of each stock in the top 10 if their past 10-year return is extrapolated forward. If the last 10-years repeats itself, the top 10 would increase to a weight of 73%. It may be sufficient to say that the current performance trajectory of the top 10 stocks is unsustainable.
Figure 3: Current Trajectory of Top 10 is Unsustainable.
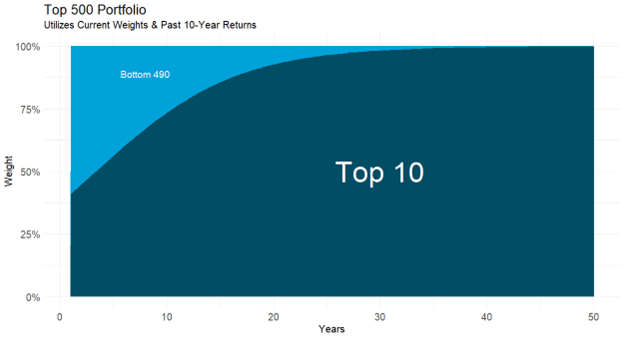
Top 500 based on the 500 largest US stocks. Chart uses current weights and past 10-year returns and applies them for 50 years into the future. Past performance does not guarantee future results. Source: Compustat. Calculation: Hartford Equity Modeling Platform.
Now that it has been established that the top 10 have reached extreme levels of concentration, we will consider whether concentration has influenced forward returns. We divided the Top 500 US stocks into the top 10 and Bottom 490. Both were equal-weighted and rebalanced monthly. Next, we used the weights in Figure 2 and combined them with the forward five-year return differential between the Top 10 Equal Weight and Bottom 490 Equal Weight.
For the entire analysis, the Bottom 490 Equal Weight outperformed the Top 10 Equal Weight in 69% of rolling five-year periods. When we divided our observations equally into thirds, the highest levels of concentration still led to Bottom 490 Equal Weight outperformance.
The third of the time the market was most concentrated, the top 10’s weight ranged from 23% to 39%. The Bottom 490 Equal Weight’s forward five-year return outperformed after 88% of those periods (Figure 4).
In the middle third of concentration levels, the Bottom 490 Equal Weight outperformed 80% of the time. We saw the reverse of this trend in the lowest third of concentration levels.
When Top 10 concentration levels stayed below approximately 19%, the Bottom 490 Equal Weight outperformed 39% of the time, so there is a time and place where the odds slightly favor market cap-weighting.
Figure 4: When Top 10 Concentration is Above 23%, Bottom 490 Equal Weight Has Outperformed 88% of the Time Over the Next Five Years.
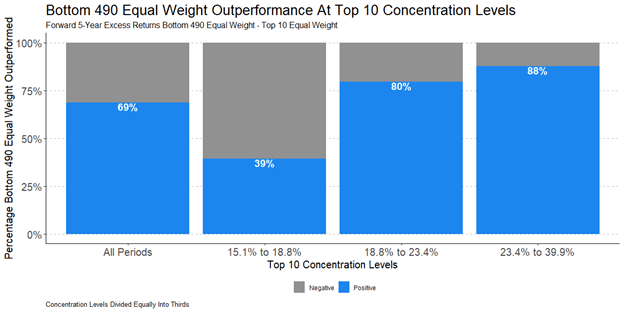
Date Range: 12/31/1964 – 12/31/2024. Past performance does not guarantee future results. Based on the 500 largest US stocks by market cap. Top 10 Equal Weight and Bottom 490 Equal Weight are equal weighted and rebalanced monthly. Source: Compustat. Calculation: Hartford Equity Modeling Platform.
Do Historical Valuations Influence Forward Returns?
In addition to concentration levels, we also examined historical valuations to determine if they influenced forward returns. The price-to-earnings ratio (P/E ratio) of the Top 10 Equal Weight compared to the Bottom 490 Equal Weight is at an extreme not seen since the peak of the 2000 technology bubble (excluding the COVID-19 period, which affected earnings figures).
The widest valuation spread between the Top 10 Equal Weight and Bottom 490 Equal Weight occurred at the beginning of 2000 as the technology bubble reached maximum inflation. Outside of the technology bubble period, the next widest valuation spreads occurred this year. While valuation metrics are terrible market timing tools in the near term, they have historically provided some indication of long-term performance.
Figure 5: Top 10 Equal Weight and Bottom 490 Equal Weight Historical P/E Ratios.
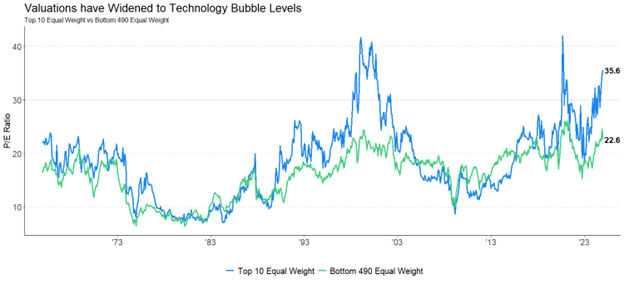
Date Range: 12/31/1964 – 12/31/2024. Based on the 500 largest US stocks by market cap. Top 10 Equal Weight and Bottom 490 Equal Weight are equal weighted and rebalanced monthly. Source: Compustat. Calculation: Hartford Equity Modeling Platform.
When comparing historical relative valuations, based on P/E ratios of the Bottom 490 Equal Weight versus the Top 10 Equal Weight, the current relative valuation would rank in the top decile. Historically, when the Bottom 490 Equal Weight has been this discounted relative to the Top 10 Equal Weight, the Bottom 490 Equal Weight outperformed by almost 7% over the following five years, on average.
Furthermore, there was only one observation where the relative valuation was in the top decile and the Bottom 490 Equal Weight did not outperform over the following five-year period.
Figure 6: Bottom 490 Equal Weight is Discounted Relative to Top 10 Equal Weight.
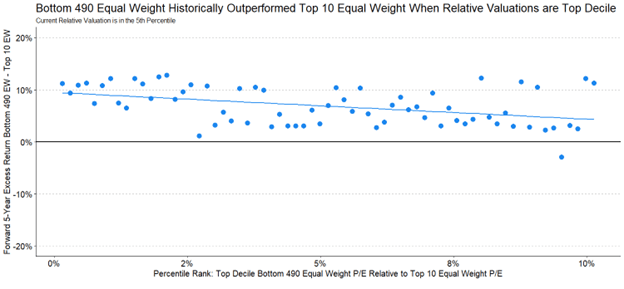
Date Range: 12/31/1964 – 12/31/2024. Past performance does not guarantee future results. Based on the 500 largest US stocks by market cap. Top 10 Equal Weight and Bottom 490 Equal Weight are equal weighted and rebalanced monthly. Above 0% the Bottom 490 Equal Weight outperformed, below 0% the Top 10 Equal Weight outperformed. Source: Compustat. Calculation: Hartford Equity Modeling Platform.
Elevated concentration and valuation levels have often preceded periods of heightened volatility and drawdowns for the largest stocks. In many of the most severe market drawdowns, the Top 10 Equal Weight has underperformed the Bottom 490 Equal Weight, including the recent bear market in 2022.
Figure 7: The Largest Stocks Have More Volatility than Commonly Perceived.
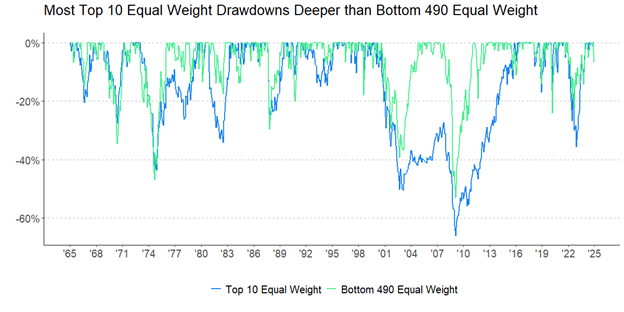
Date Range: 12/31/1964 – 12/31/2024. Past performance does not guarantee future results. Based on the 500 largest US stocks by market cap. Top 10 Equal Weight and Bottom 490 Equal Weight are equal weighted and rebalanced monthly. Source: Compustat. Calculation: Hartford Equity Modeling Platform.
Not only do periods of high concentration and relative valuations lead to heightened volatility, but they have also led to disappointing long-term returns commonly referred to as “lost decades.” There have been multiple lost decades throughout market history, with most of them occurring after periods of extreme market concentration and relative valuations.
The unwinding of the concentration built up during the 1990s technology/growth bubble led to a lost decade (Figure 8) because the return of a market cap-weighted Top 500 was negative over a 10-year period. Another lost decade (Figure 9) occurred after an egregious episode of market concentration in the 1960s led to a 10-year period with negative returns for the largest stocks, but positive returns for the middle of the market. These lost decades demonstrated the power of diversification as the Bottom 490 Equal Weight often outperformed the Top 500.
Figure 8: Annualized Returns for the Lost Decade March 31st 2000 – March 31st 2010.
| Top 500 | -0.99% |
| Top 10 Equal Weight | -6.63% |
| Bottom 490 Equal Weight | 2.55% |
| Next 500 Equal Weight | 5.44% |
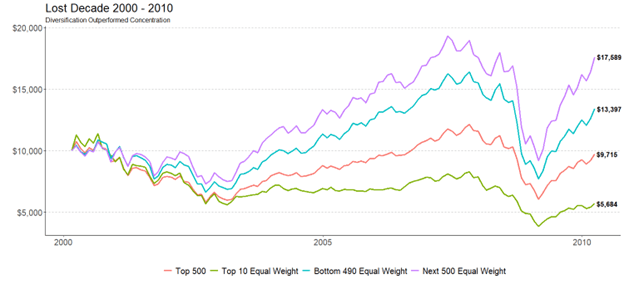
Date Range: 3/31/2000 – 3/31/2010. Past performance does not guarantee future results. Top 10represents the largest 10 largest stocks by market cap out of the top 500 largest US stocks. Top 10 is equal weighted and rebalanced monthly. Bottom 490represents the next largest 490 stocks by market cap weight out of the top 500 largest US stocks. The Bottom 490 is equal weighted and rebalanced monthly. Next 500 represents next-largest 500 US stocks by market cap, after the first 500 largest US stocks. Next 500 is equal weighted and rebalanced monthly. Source: Compustat. Calculation: Hartford Equity Modeling Platform.
Figure 9: Annualized Returns for the Lost Decade December 31st 1964 to December 31st 1974.
| Top 500 | 1.24% |
| Top 10 Equal Weight | -0.44% |
| Bottom 490 Equal Weight | 3.09% |
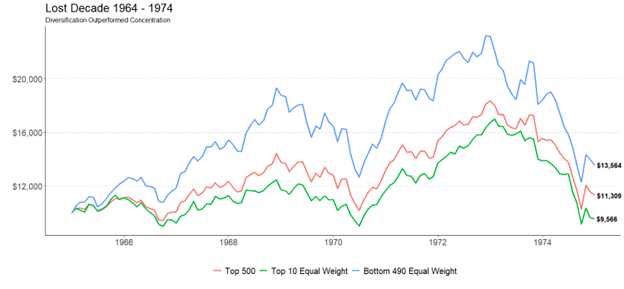
Date Range: 12/31/1964 – 12/31/1974. Past performance does not guarantee future results. Top 10represents the largest 10 largest stocks by market cap out of the top 500 largest US stocks. Top 10 is equal weighted and rebalanced monthly. Bottom 490represents the next largest 490 stocks by market cap weight out of the top 500 largest US stocks. The Bottom 490 is equal weighted and rebalanced monthly. Source: Compustat. Calculation: Hartford Equity Modeling Platform. *Next 500 was excluded from analysis due to lack of stocks in starting universe.
Over the last 10 years, market cap-weighted indices have dominated the investment landscape, like past episodes of market concentration in the 1960s and 1990s. While market cap-weighted indices have been beneficial for the average investor, are these same investors prepared if we enter another lost decade like the ones that transpired after past incidents of market concentration?
Market history shows us the continuation of this concentration will be difficult to achieve, unless we can envision a world where 10 stocks make up more than two-thirds of the market into the 2030s.
Modern portfolio theory has taught professional investors the benefits of diversification. Maybe it is time to diversify in a more intentional way to reduce extreme market concentration.
Disclosure
Hartford Funds Distributors, LLC. Member FINRA. Hartford Funds may or may not be invested in the companies referenced herein; however, no particular endorsement of any product or service is being made.


