
When things seem too good to be true for the stock market, they usually are.
Move over, Superman! The only thing more powerful than a locomotive at the moment is the U.S. stock market, which, seemingly faster than a speeding bullet, has rallied to new heights.
When the closing bell tolled on Sept. 11, the benchmark S&P 500 (^GSPC -0.05%), iconic Dow Jones Industrial Average (^DJI -0.59%), and growth stock-dependent Nasdaq Composite (^IXIC 0.44%) all catapulted to record closing highs. Everything from the evolution of artificial intelligence (AI) — a potentially $15.7 trillion global addressable opportunity by 2030, according to PwC — to the growing prospect of a Federal Reserve rate cut in September has fueled optimism and risk-taking.
But the tricky thing about Wall Street is that when things seem too good to be true, they usually are.
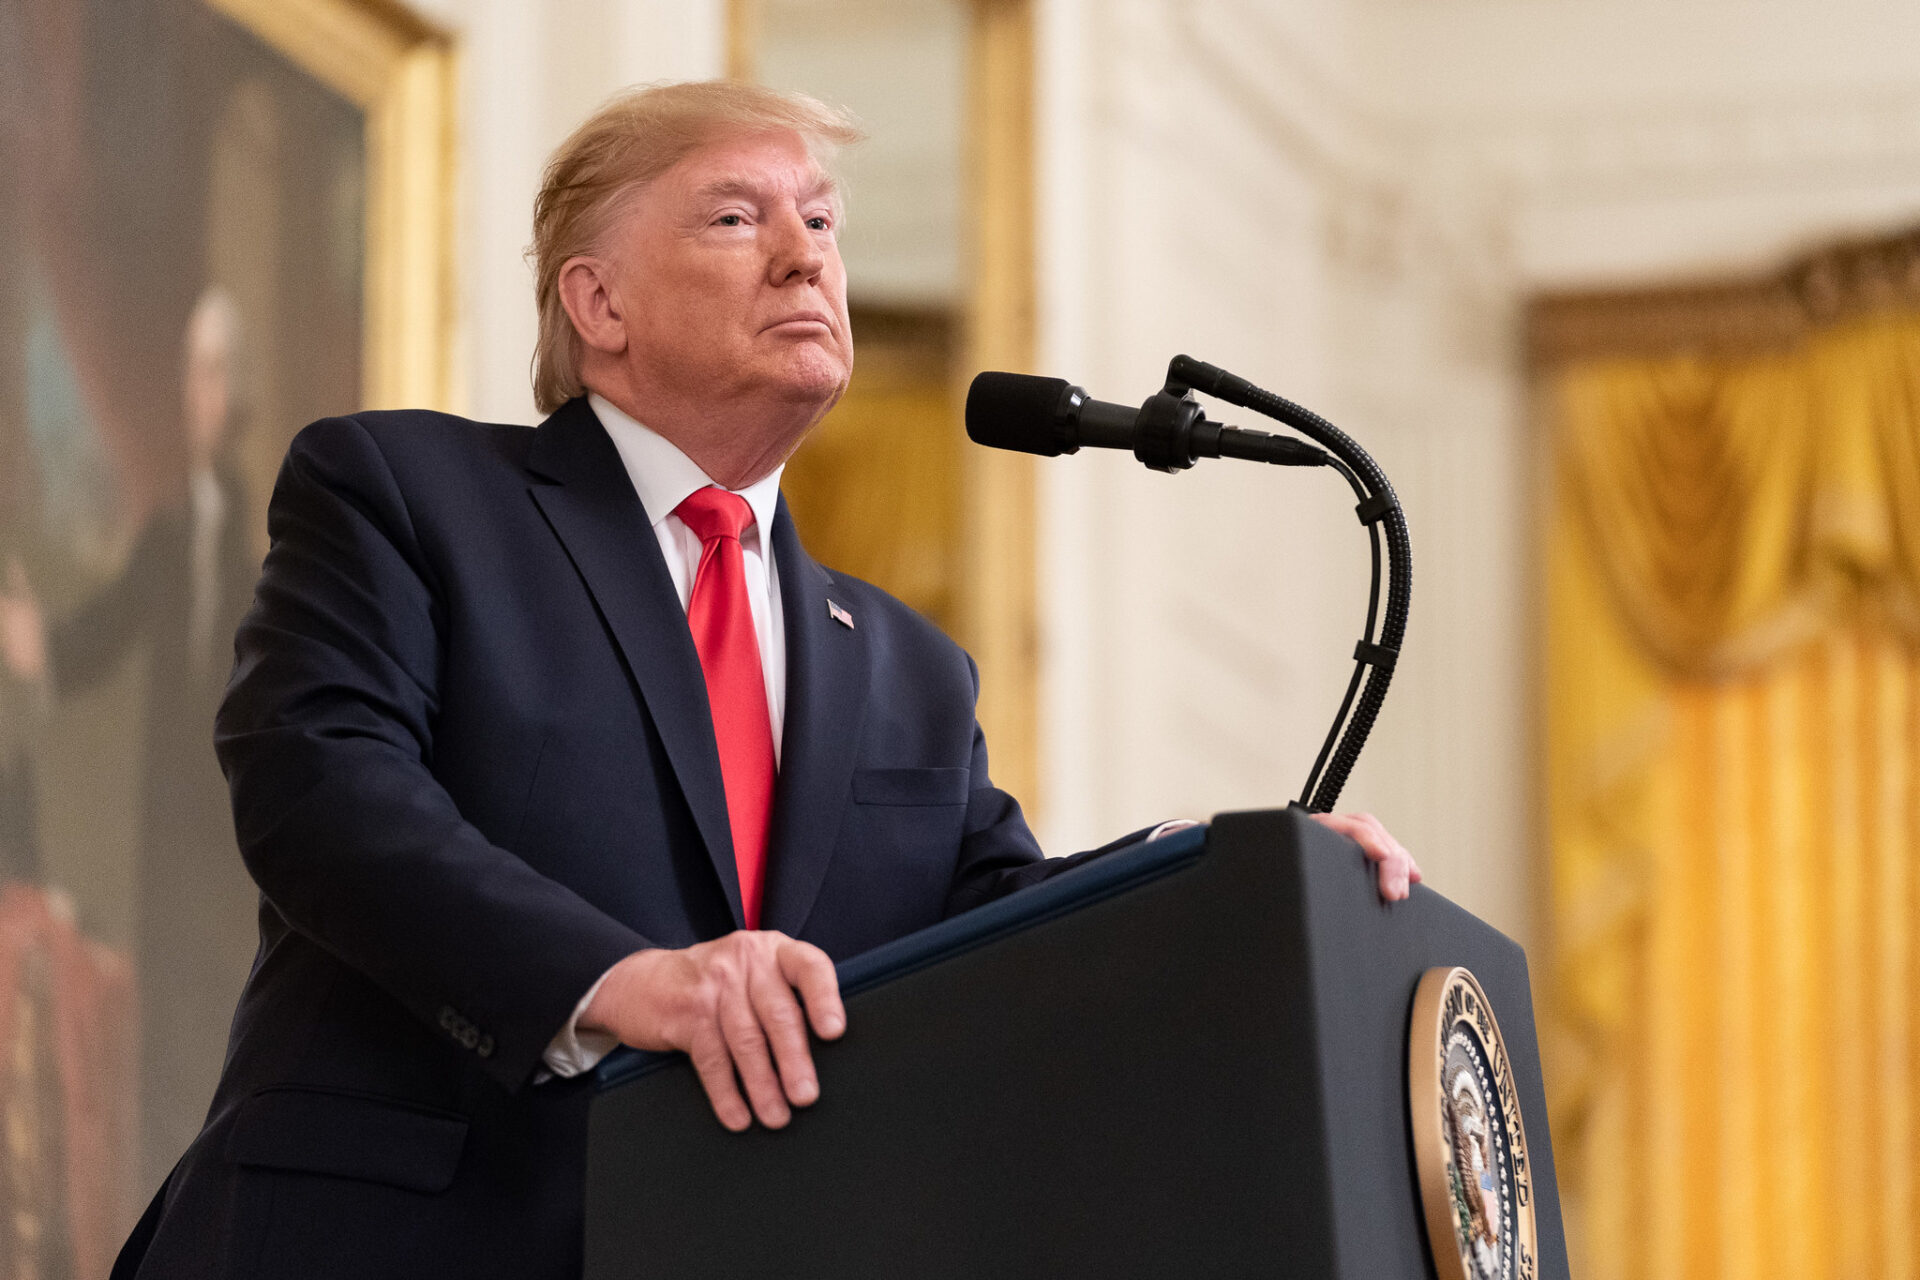
President Trump delivering remarks. Image source: Official White House Photo by Shealah Craighead, courtesy of the National Archives.
While a lot of attention is currently being paid to President Donald Trump's tariff and trade policy and how it might adversely impact the U.S. economy by influencing the prevailing rate of inflation, there's a far more sinister concern waiting in the wings, based on what history tells us.
Donald Trump's tariff and trade policy is in the spotlight
Although the S&P 500, Dow Jones, and Nasdaq Composite have soared year to date, things looked a lot different in early April. Following the close of trading on April 2, President Trump unveiled his widely touted trade policy, which included a 10% global base tariff, as well as the implementation of higher “reciprocal tariffs” on dozens of countries deemed to have adverse trade imbalances with America. The stock market plunged in the subsequent days, with the S&P 500 tallying its fifth-steepest two-day decline since 1950.
To be fair, what Trump unveiled on April 2 and the current tariff policies in place today look markedly different. A number of countries/regions have hashed out trade deals with America, and the president has delayed the implementation date of reciprocal tariffs for select countries.
Additionally, there's no guarantee Trump's tariffs will legally remain in place. In November, the Supreme Court will consider the validity of the president's tariffs following an appeal from the Trump administration after lower courts ruled most of his tariffs were illegal.
Despite these uncertainties, worry about Donald Trump's tariff and trade policy, specifically pertaining to its effect on inflation, is heightened.
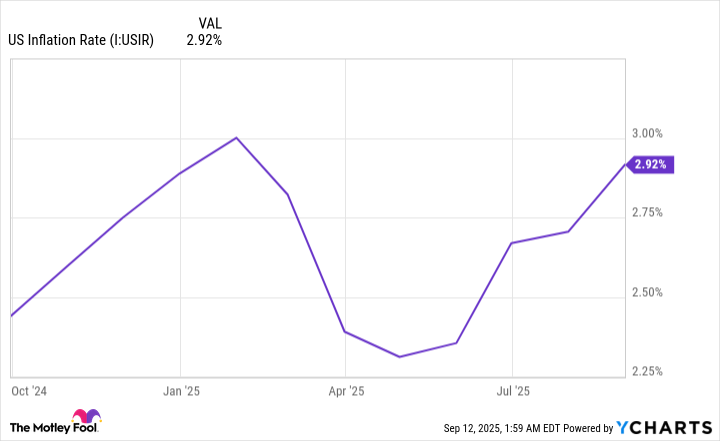
The domestic rate of inflation has moved decisively higher as the president's tariffs take effect. US Inflation Rate data by YCharts.
In the three months since Trump's tariffs began having a discernable impact on the U.S. economy, the inflation rate, as measured by the Consumer Price Index for All Urban Consumers (CPI-U), jumped from 2.35% to 2.92%. It's quite the jump, and it's certainly raising eyebrows amid a weakening job market.
The biggest issue with Trump's tariff policy, as told by four New York Federal Reserve economists who published a study in December 2024 for Liberty Street Economics, is that it does a poor job of separating output and input tariffs.
In their study, Do Import Tariffs Protect U.S. Firms?, the four New York Fed economists examined the impact of Trump's China tariffs in 2018-2019 on the U.S. economy and businesses. What they found was added pricing pressure on domestic manufacturers caused by the China trade war. Whereas output tariffs are placed on finished products, an input tariff is a duty for a good used to complete the manufacture of a product in the U.S. This type of tariff runs the risk of increasing production costs and reigniting the prevailing rate of inflation.
While some degree of pricing power is a good thing for businesses, the inflationary ramp-up we've witnessed over the previous three months is a bit concerning.
Image source: Getty Images.
Wall Street's ticking time bomb is nearing historic levels
But even though Donald Trump's tariffs are pretty consistently in the headlines, they're not Wall Street's biggest concern. Based on historical precedent, valuation is the ticking time bomb ready to pull the rug out from beneath the S&P 500, Dow Jones Industrial Average, and Nasdaq Composite at any moment.
Truth be told, there isn't a one-size-fits-all blueprint when it comes to valuing stocks. That you might find a stock to be expensive while another investor believes it to be a bargain is precisely what makes the stock market a market in the first place.
However, there's one valuation tool that leaves little interpretative wiggle room: the S&P 500's Shiller price-to-earnings (P/E) ratio, also referred to as the cyclically adjusted P/E (CAPE) ratio.
The most familiar of all valuation tools is the P/E ratio, which divides a company's share price by its trailing-12-month earnings per share (EPS). While this is a handy valuation measure for mature businesses, it often fails to pass muster during recessions and for high-growth companies. This isn't a problem for the S&P 500's Shiller P/E since it's based on average inflation-adjusted EPS over the prior 10 years. It means shock events have minimal impact on the Shiller P/E ratio.
When back-tested 154 years to January 1871, the Shiller P/E has averaged a multiple of 17.28. As of the closing bell on Sept. 11, it clocked in at 39.58, which is the highest reading during the current bull market and the third-priciest multiple during a continuous bull market in over 150 years. The only two times the CAPE ratio has been higher are when it fractionally topped 40 during the first week of January 2022 and when it peaked at its all-time high of 44.19 in December 1999.
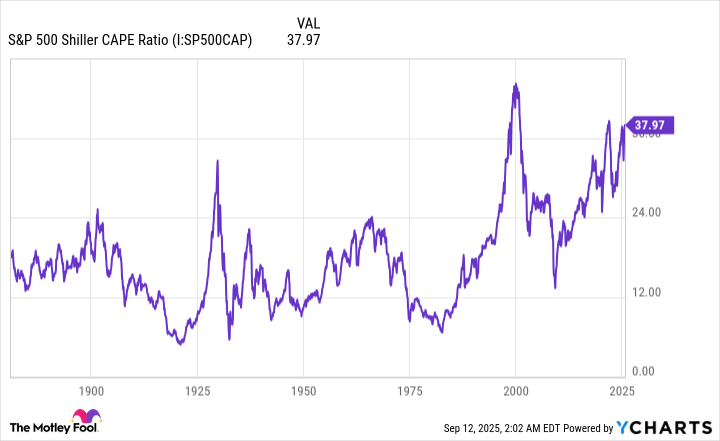
S&P 500 Shiller CAPE Ratio data by YCharts. CAPE Ratio = cyclically adjusted price-to-earnings ratio.
Admittedly, the S&P 500's Shiller P/E isn't a timing tool. Just because stocks are historically pricey, it doesn't mean a game-changing innovation like artificial intelligence can't keep valuations at nosebleed levels for months, perhaps even a few years. However, history is unmistakably clear in showing that premium valuations eventually end in short-term disaster.
Including the present, there have been six instances since 1871 where the Shiller P/E ratio has topped 30 for at least a two-month period. Following each of the previous five instances, the S&P 500, Dow Jones Industrial Average, and/or Nasdaq Composite tumbled between 20% and 89%. While the 89% is an outlier for the Dow during the Great Depression, plunges of 50% or more are not out of the question, as was witnessed during the bursting of the dot-com bubble in the early 2000s.
If there's a silver lining for this ticking time bomb, it's that bear markets are historically short-lived.
In June 2023, Bespoke Investment Group calculated the calendar-day length of every S&P 500 bull and bear market dating back to the start of the Great Depression in September 1929. Bespoke found that the average length of 27 documented S&P 500 bear markets was just 286 calendar days, or less than 10 months. In comparison, the average bull market stuck around for 3.5 times as long, or 1,011 calendar days.
Even though history is quite clear that trouble is brewing on Wall Street, long-term investors remain in the driver's seat.

![Security Alert – [Previous security patch can lead to invalid state root on Go clients with a specific transaction sequence – Fixed. Please update.]](https://moneyvisa.com/wp-content/uploads/2025/07/Announcing-the-Trillion-Dollar-Security-Initiative-560x420.jpeg "Security Alert – [Previous security patch can lead to invalid state root on Go clients with a specific transaction sequence – Fixed. Please update.]")


 Stock Sinks As Market Gains: Here’s Why")
 Outpaces Stock Market Gains: What You Should Know")


 Stock Sinks As Market Gains: Here’s Why")
 Stock Dips While Market Gains: Key Facts")