

Key takeaways:
-
Bitcoin’s Bollinger Bands indicator reached a critical turning point for bulls.
-
Bitcoin’s cup-and-handle pattern targets $300,000, backed by multiple tailwinds.
A Bitcoin indicator used by traders to assess volatility has reached a critical turning point, suggesting that a significant price move may be underway.
Crypto trader and analyst Matthew Hyland noted that Bitcoin’s (BTC) Bollinger Bands — a tool that measures the momentum and volatility of an asset within a certain range — have reached their “most extreme level” in the monthly time frame since its inception in January 2009.
He wasn’t the only trader to spot the emerging pattern.
“The Bitcoin Bollinger Bands on the 1M (monthly) are at historical tightness,” popular analyst Crypto Ceasar said, adding,
“This has previously led to heavy volatility to the upside. Bitcoin could be in for a spicy Q4.”
The Bollinger Bands on the 1M (monthly) are at historical tightness. This has previously led to heavy volatility to the upside (see chart).
Bitcoin could be in for a spicy Q4 🐂🫡 pic.twitter.com/sOmeLIYPgT
— 👑Crypto Caesar👑™️ (@crypto_caesar1) September 6, 2025
Previous contractions in 2012, 2016 and 2020 all “preceded explosive price expansions,” crypto investor Giannis Andreou said in an X post last week, adding that the current setup is even tighter, indicating the potential for the largest move ever seen in BTC price.
“Huge volatility ahead!”
It is not the first time in this bull market that the Bands have pointed to major BTC price upside. As Cointelegraph reported, in early July, a squeeze on the three-day chart precluded the run to the current all-time highs above $124,500 reached on Aug. 14.
Bitcoin’s cup-and-handle pattern targets $300,000
As Cointelegraph continues to report, multiple factors are putting Bitcoin in a good position for more upside despite recent failed attempts to sustain a recovery above $112,000.
In addition to impending Fed interest rate cuts and bullish onchain metrics, Bitcoin may mirror gold’s rally and regain momentum toward $185,000 and beyond.
Related: Bitcoin wobbles after shocking US jobs revision: What’s next for BTC?
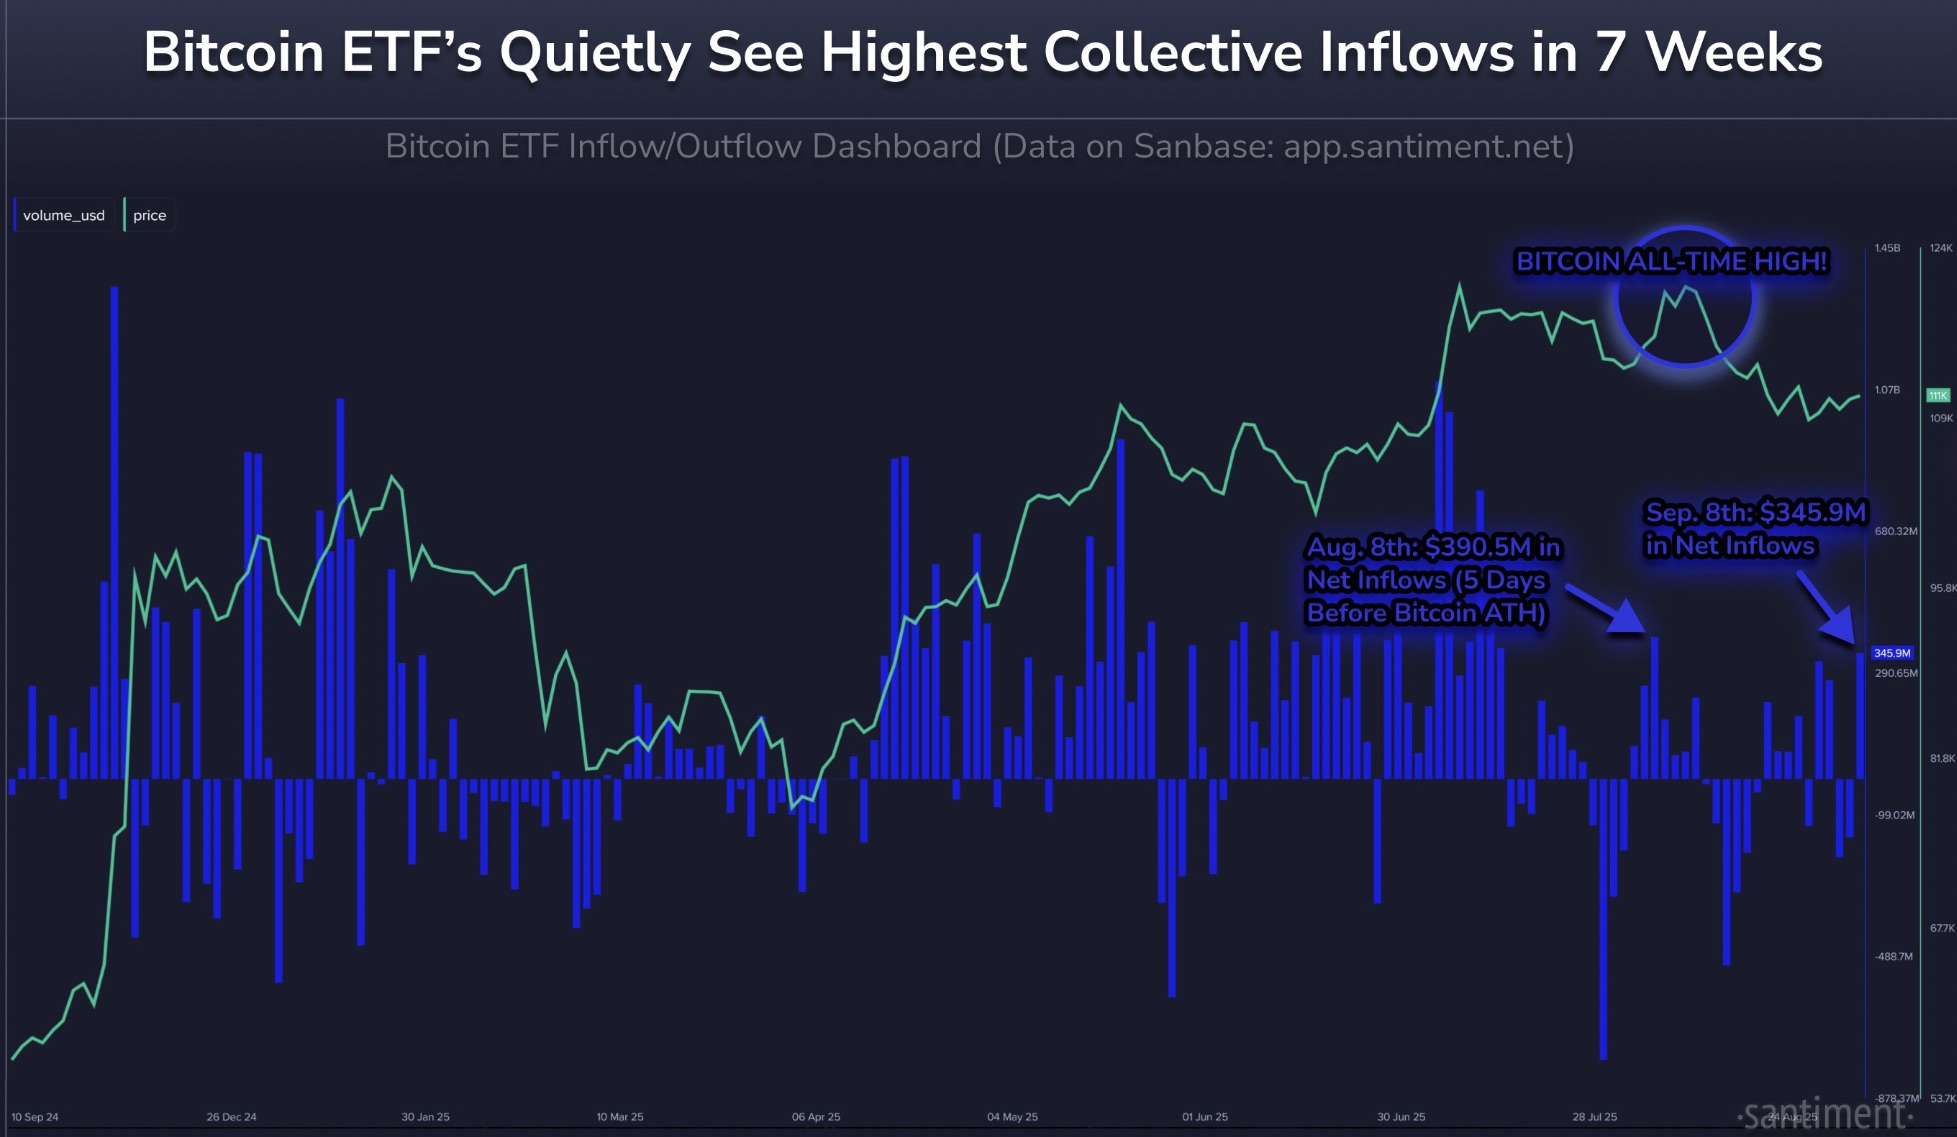
Persistent institutional demand through spot Bitcoin ETFs and treasury companies reinforces Bitcoin’s upside as spot BTC ETF in flows flipped positive on Monday.
“Money is moving back into Bitcoin ETFs at a rapid rate as retailers impatiently drop out of crypto,” said market intelligence firm Santiment in a Wednesday X post, adding:
“Previous crypto rallies were boosted by inflow spikes like this.”
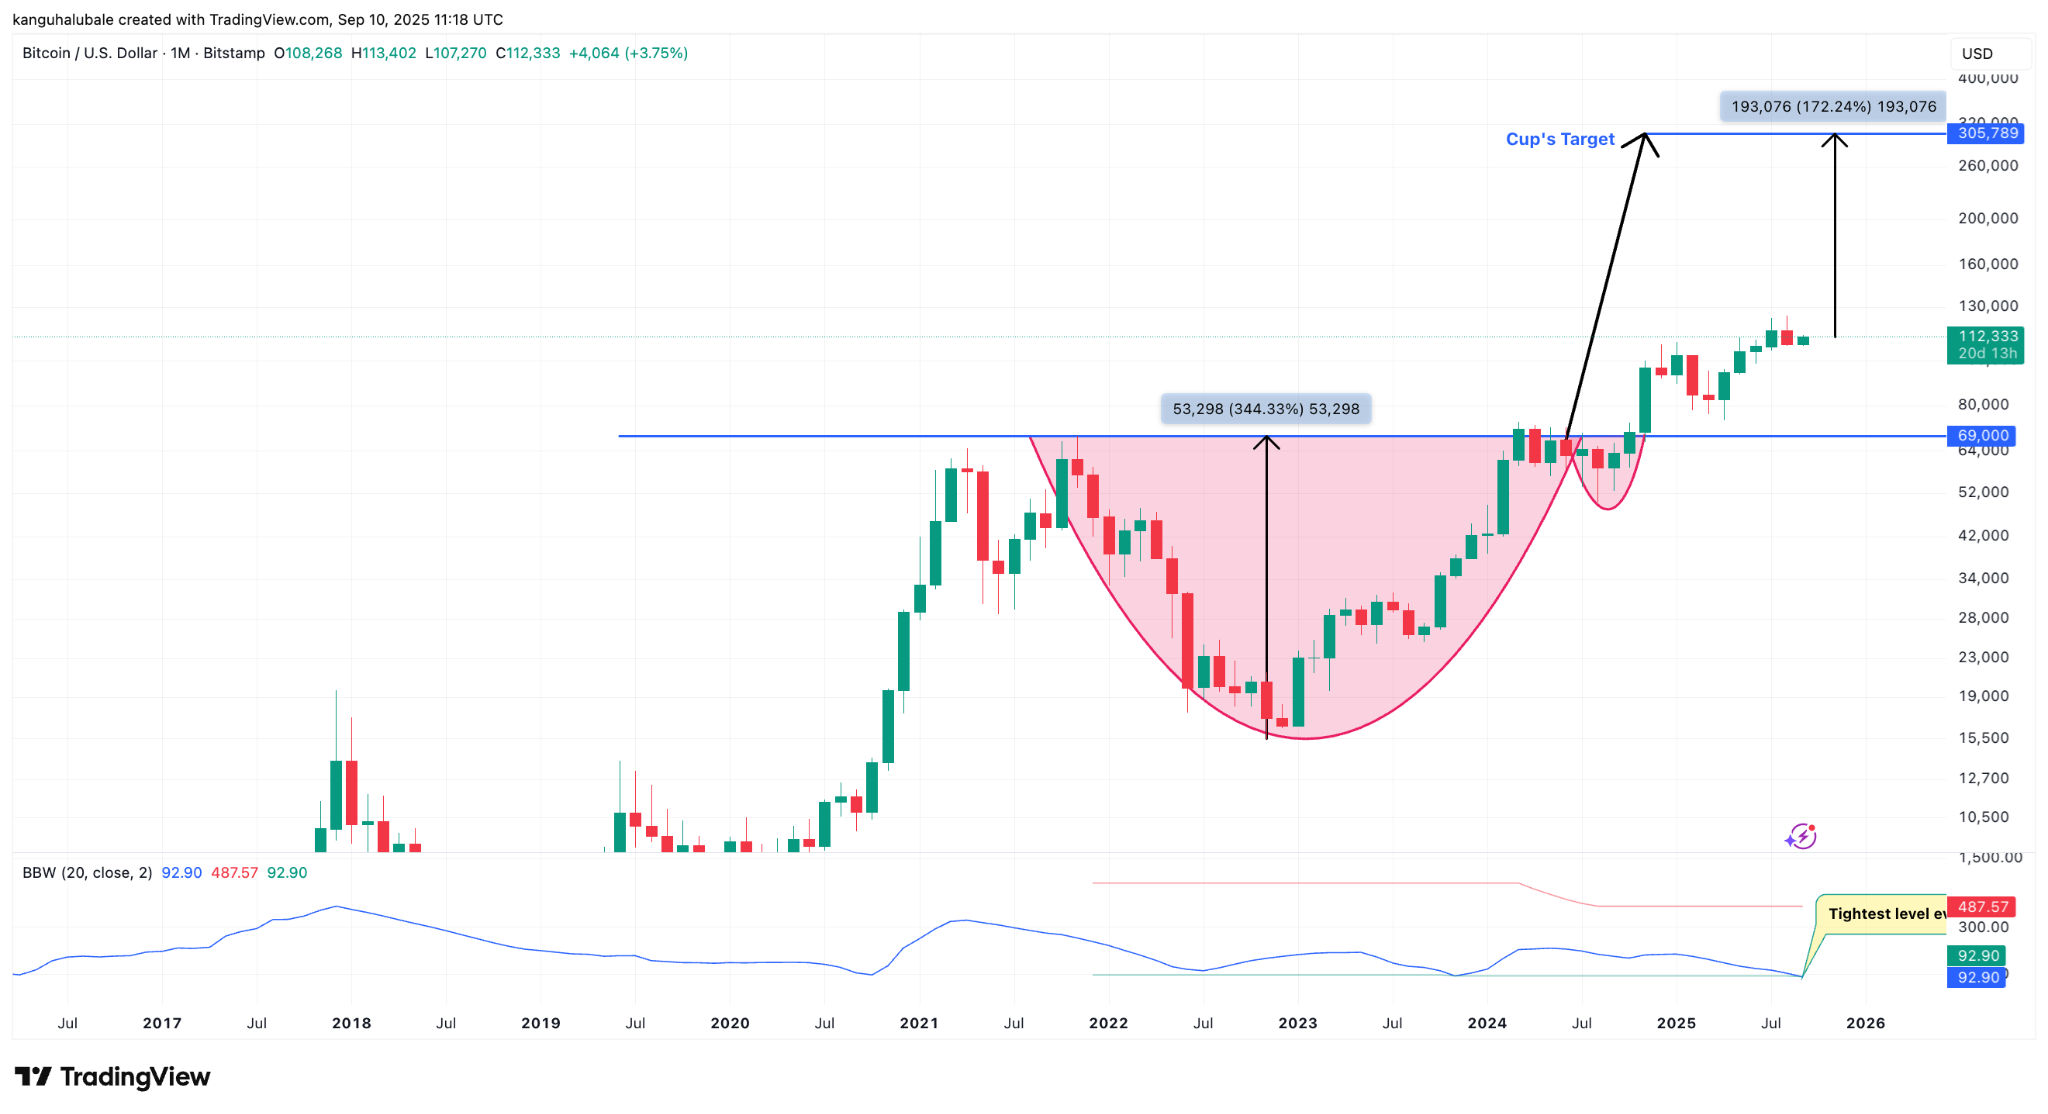
The monthly chart shows that the price broke above the cup-and-handle neckline at $69,000 in November 2024. Bitcoin is still validating the breakout and could rise to complete the maximum distance between the cup’s trough and the neckline.
That puts Bitcoin’s cup-and-handle breakout target for 2025–2026 at around $305,000, up by more than 170% from current price levels.
However, it is important to note that a cup-and-handle doesn’t always guarantee the full upside move. A study by veteran analyst Thomas Bulkowski found that only 61% of these setups reach their expected targets.
As Cointelegraph reported, Bitcoin is in the middle of a classic bull cycle correction phase after all-time highs, which may bottom out around $104,000 before another leg higher.
This article does not contain investment advice or recommendations. Every investment and trading move involves risk, and readers should conduct their own research when making a decision.


