

This article is adapted from a version originally published in the fall issue of The Journal of Performance Measurement®.
Overview
Investment management is a three-part process:
- Set goals for risk and return
- Select investments
- Evaluate the results
Often carried out in isolation by different, unconnected groups, these activities can lead to disappointment when expectations are not met. The portfolio construction process is the most common source of disappointment. Why? Because the set of funds selected to implement the asset allocation ends up altering the asset allocation. This leaves the client with a set of market exposures that differ from what they expected. This is a problem that receives little attention.
Here we outline a process for identifying and evaluating this benchmark misfit risk using a portfolio of funds in a diversified global asset allocation.
Asset Allocation: The First Step
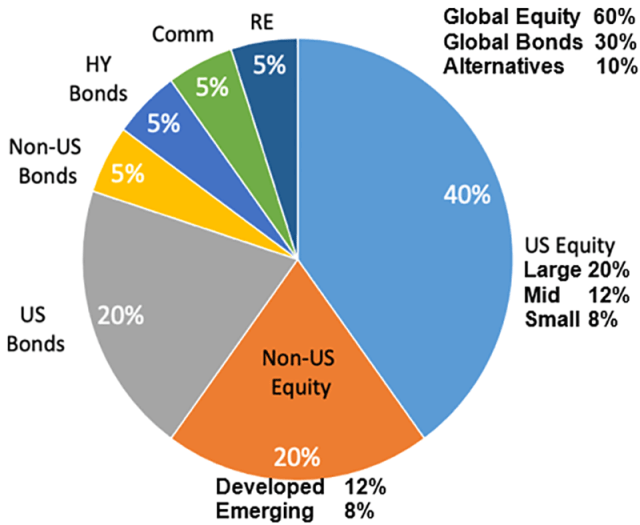
Our case study begins with a globally-diversified strategy that includes publicly traded investments: stocks, bonds, and alternatives as demonstrated in the following chart.
Asset Allocation
Portfolio Construction: Turning the Plan into a Portfolio
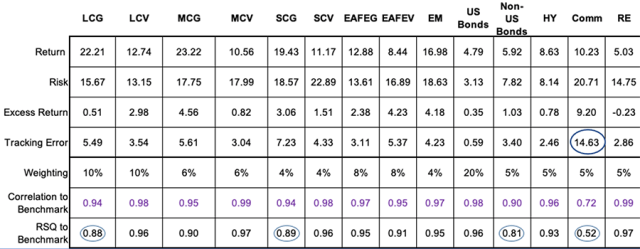
An asset allocation becomes an investment portfolio when specific funds are selected. Each fund is expected to act like its benchmark with a comparable return pattern and level of risk. Hopefully, it earns a higher return after adjusting for both risk and fees. We evaluate active risk, or tracking error, by measuring how closely each fund’s return pattern aligns with its benchmark based on the correlation of the fund and that benchmark. But the square of the correlation is the more useful statistic. It answers the critical question: What percent of each fund’s return is driven by factors in its benchmark?
Many investors assume that investment selection is the sole driver of tracking error. This is a mistake. Unfortunately, much of the portfolio’s tracking error is often determined by a different set of market exposures, with the source of this misfit risk produced within its funds. We must separate the effect of these structural differences. Only then can we calculate the true investment selection effect.
Introducing the Portfolio’s Funds
Our asset allocation includes 14 segments. These are organized by asset class (global equity, global bonds and alternatives); asset segment (US equity vs. non-US equity); and style (value vs. growth). We used net-of-fee returns for the funds in this analysis.
Portfolio’s Funds: Performance over Five Years
Determining Each Fund’s Effective Exposures
Our first step was to derive the effective exposures for each of the portfolio’s funds. We conducted a regression analysis to determine the weightings of each of the portfolio’s segments so that the return of this effective fund index had the highest correlation to each fund.
We then constructed a table of our results, expressing each fund in terms of its effective market segment weights. We applied these weights to the allocation for each fund; the result shows each fund’s contribution to the segment weightings for the overall portfolio. By summing these contributions across all funds, we determine the portfolio’s effective exposure to each market segment.
Effective Exposures for Funds and for the Total Portfolio
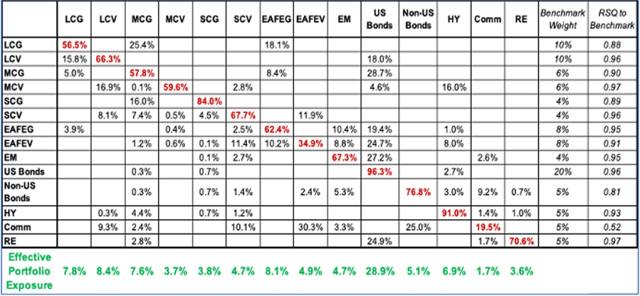
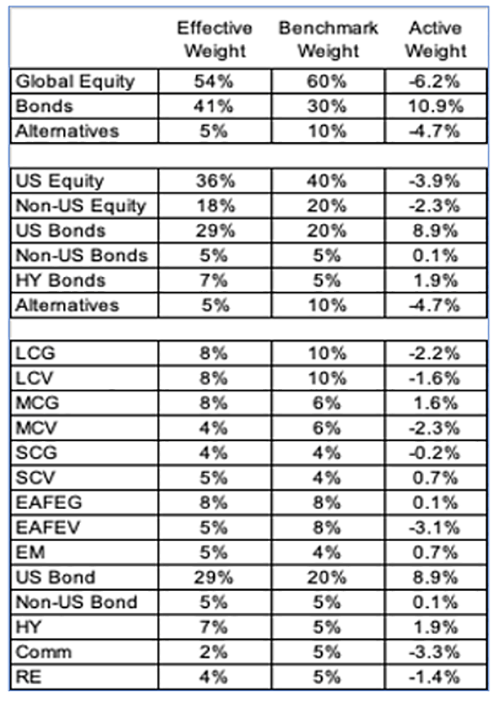
These results show how each fund behaves rather than what it looks like or calls itself. By subtracting the total portfolio exposures from the asset allocation target weights, we determine the effective active exposures for the portfolio. These produce a long-term allocation effect found in the portfolio’s performance-attribution analysis. These active weights are a key driver of the portfolio’s tracking error.
Active Weights
Traditional Review of Performance
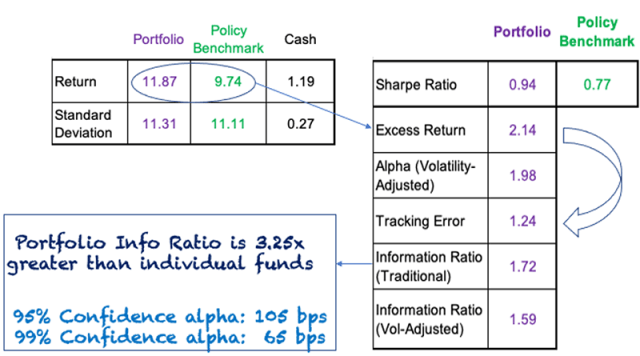
The portfolio outperformed its benchmark on an absolute and a risk-adjusted basis, with low tracking error relative to its excess return. Its information ratio of 1.7 is high enough to provide statistical confidence in this set of funds, and was more than three times that of its funds.
Performance Results: A Very Good Story
Relative Performance with Misfit Benchmark
Drivers of Portfolio Performance
Without the insights from the portfolio’s effective exposures, we would believe that the funds’ investment selection process added substantial excess return with only a small increase in risk.
Performance with Effective Exposures (Misfit Benchmark)
| Cash | Portfolio | Policy Benchmark |
Effective Exposures |
|
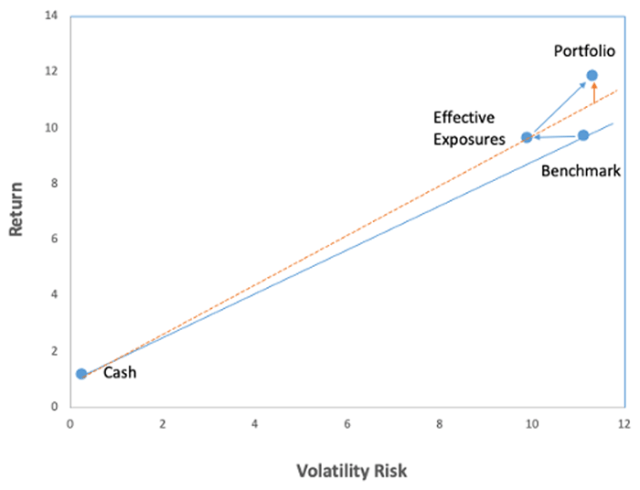
| Return | 1.19 | 11.87 | 9.74 | 9.66 |
| Risk | 0.27 | 11.31 | 11.11 | 9.89 |
The inclusion of benchmark misfit on performance changes everything! Instead of issue selection driving a slight increase in risk with a tremendous increase in return, misfit lowered volatility with selection adding substantially to risk but only modestly to return. This changes the narrative completely.
Attribution of Total Return and Total Risk
| Benchmark | Misfit | Selection | Total | |
| Contribution to Total Return |
9.74 | -0.07 | 2.21 | 11.87 |
| Contribution to Total Volatility |
11.05 | -1.19 | 1.46 | 11.31 |
| Correlation to Portfolio Total Return |
0.994 | -0.86 | 0.87 |
Incorporating Misfit Risk into Active Return Attribution Analysis
We apply the same principles to the portfolio’s excess returns, starting with the excess return and tracking error for each component.
Active Results
| Misfit Excess Return |
Selection Excess Return |
Total Excess Return |
|
| Return | -0.07 | 2.21 | 2.14 |
| Volatility | 1.38 | 1.69 | 1.24 |
Attribution of Active Return
| Misfit | Selection | Total | |
| Contribution to Excess Return | -0.07 | 2.21 | 2.14 |
| Contribution to Portfolio Tracking Error |
0.25 | 1.00 | 1.24 |
| Correlation to Portfolio Excess Return |
0.18 | 0.59 |
According to our data, misfit contributes only 25 bps (18%) of its own tracking error to the portfolio, while selection contributes 100 bps (almost 60%) of its own tracking error. These results were driven by their respective correlations to the portfolio’s excess return. A critical point: From the perspective of the total portfolio manager, misfit risk is an unmanaged aspect of the portfolio. It is reassuring to know that this does not dominate the portfolio’s active performance results.

A Quick Look at the Funds
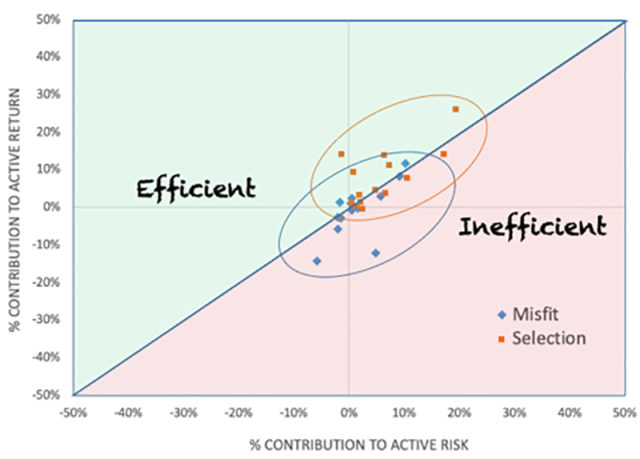
We separated each fund’s active contributions to the portfolio’s total misfit risk and selection results. This is shown on a percent of total basis, where efficiency is measured in terms of equal contributions to risk and return. This clearly demonstrates that the deliberate investment selection process was more efficient than the unintended consequence of the benchmark misfit effect.
Misfit and Selection Contributions by Fund
Conclusions
Contrary to popular opinion, a portfolio’s funds are more likely to undermine its asset allocation rather than deliver the allocation in the form of actively managed investments. A decision-based view of the investment process demonstrates that benchmark misfit is the result of actions taken by the portfolio’s underlying fund managers, who often seek excess return by deviating from their own benchmarks, sometimes investing outside their mandates. This return-seeking focus often works against the primary source of a portfolio’s returns: its asset allocation. The responsibility for controlling benchmark misfit lies with the manager of the multi-asset portfolio.
The fund-selection process should shift its focus from an alpha-first selection of individual funds to assembling a team of funds whose aggregate set of effective exposures closely tracks the portfolio benchmark. This risk-aware approach tends to produce portfolios where tracking error is minimized as benchmark misfit is reduced, and its excess return is enhanced via diversification across the funds’ excess returns.

The result should be similar to those of our case study: a portfolio information ratio that is a multiple of its funds’ values. This produces a higher level of confidence in projections and expectations of excess return from the fund team.
This framework leads to a more cohesive and holistic investment process.
For more from Stephen Campisi, CFA, read the original version of this article from the Fall issue of The Journal of Performance Measurement®.
If you liked this post, don’t forget to subscribe to Enterprising Investor.
All posts are the opinion of the author. As such, they should not be construed as investment advice, nor do the opinions expressed necessarily reflect the views of CFA Institute or the author’s employer.
Image credit: ©Getty Images/MANUEL FIL ORDIERES GARCIA
Professional Learning for CFA Institute Members
CFA Institute members are empowered to self-determine and self-report professional learning (PL) credits earned, including content on Enterprising Investor. Members can record credits easily using their online PL tracker.


