

Key takeaways:
-
The Bitcoin options skew and stablecoin activity show fear remains contained, pointing to limited downside pressure.
-
Spot BTC ETF flows and top trader positioning confirm liquidity and resilience, signaling recovery potential above $120K.
Bitcoin (BTC) fell to an 11-day low of $114,755 on Monday, igniting debate over whether Thursday’s record high signaled the end of the current bull run. Yet four distinct indicators suggest the correction is only temporary and that Bitcoin may soon reclaim the $120,000 mark.
The Bitcoin options skew metric climbed to its highest point in four months, highlighting sudden and excessive fear. In balanced conditions, the skew should move between -6% and +6%. When demand for protective put options increases, the indicator jumps above the neutral band, while periods of FOMO push it below.
History shows such events often create strong buying opportunities. On Aug. 5, a similar skew jump was followed by a $9,657 rally within six days. Likewise, when Bitcoin plunged to $74,587 on April 9, the skew touched 13%, setting the stage for a double bottom and an $11,474 recovery in just four days.
Some investors are now afraid that outflows from spot Bitcoin exchange-traded funds (ETFs) could begin, especially after a seven-day inflow streak ended on Friday. Yet the panic seems misplaced. Between July 31 and Aug. 5, the ETFs registered $1.45 billion in net outflows, which translated into only a modest 6% correction to $112,000.
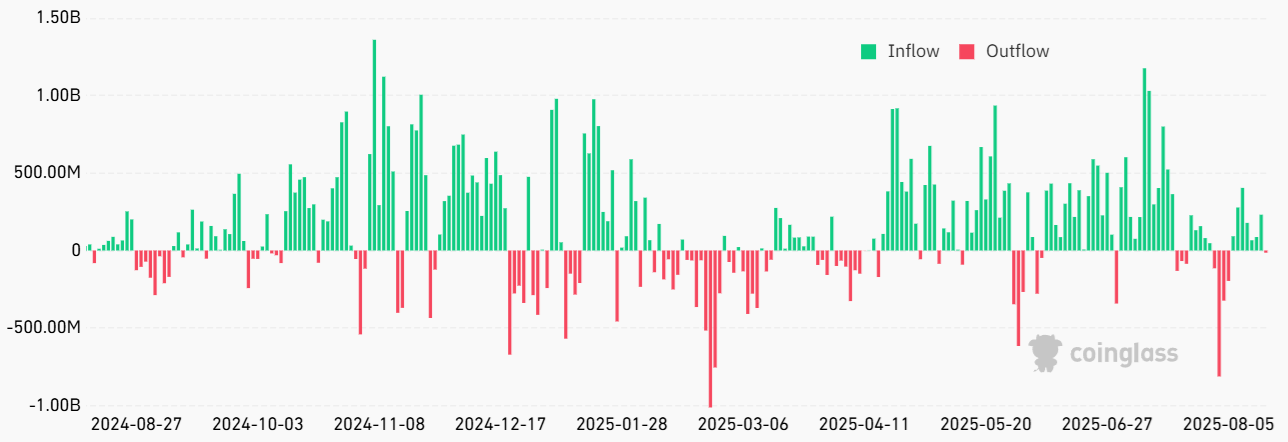
Spot Bitcoin ETFs represent a $152 billion market, meaning 1% inflows or outflows over a short span should be considered normal. Given the lower volatility in recent months, liquidity remains strong enough to absorb large ETF redemptions. Notably, the last time Bitcoin moved more than 12% within 72 hours was April 7.
Bitcoin top traders did not reduce their longs, reinforcing the bullish thesis
Positions from top traders at OKX and Binance show little reaction to the latest price drop. These data cover spot, margin and futures markets, offering a broader view of how professional players are positioned.
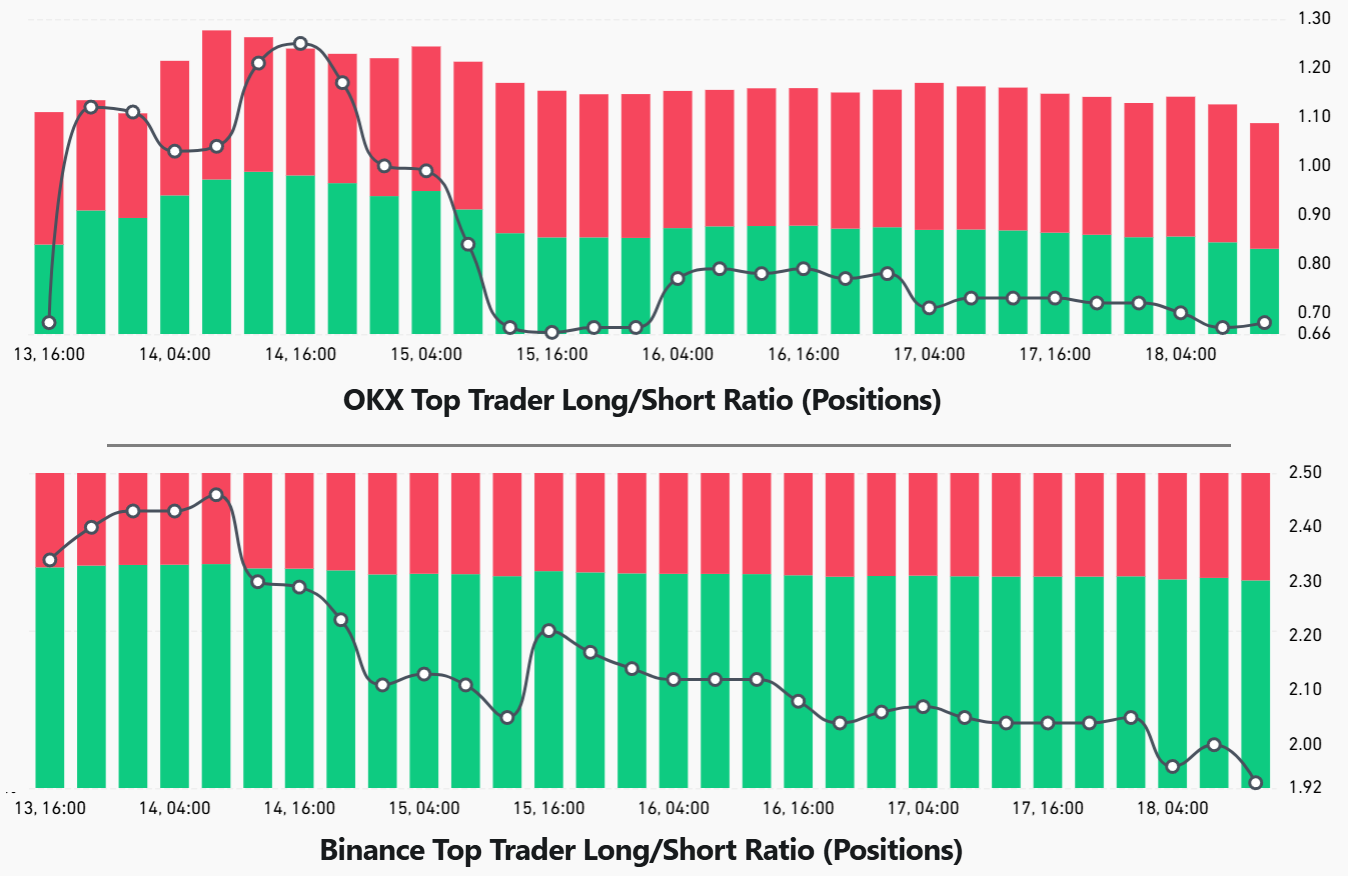
Although top traders reduced longs between Thursday and Friday, the long-to-short ratio has since stabilized. While some may argue these traders hesitate to buy the dip at $115,000, it is equally possible they are waiting for a potential retest of $112,000 before deploying additional capital.
Stablecoin demand in China offers further perspective. Strong retail-driven activity usually pushes stablecoins to trade at a 2% premium against the official US dollar rate. By contrast, a discount above 0.5% often reflects fear, as traders exit crypto holdings.
Related: Strategy adds $51M in Bitcoin as price hit $124K ahead of sharp dip
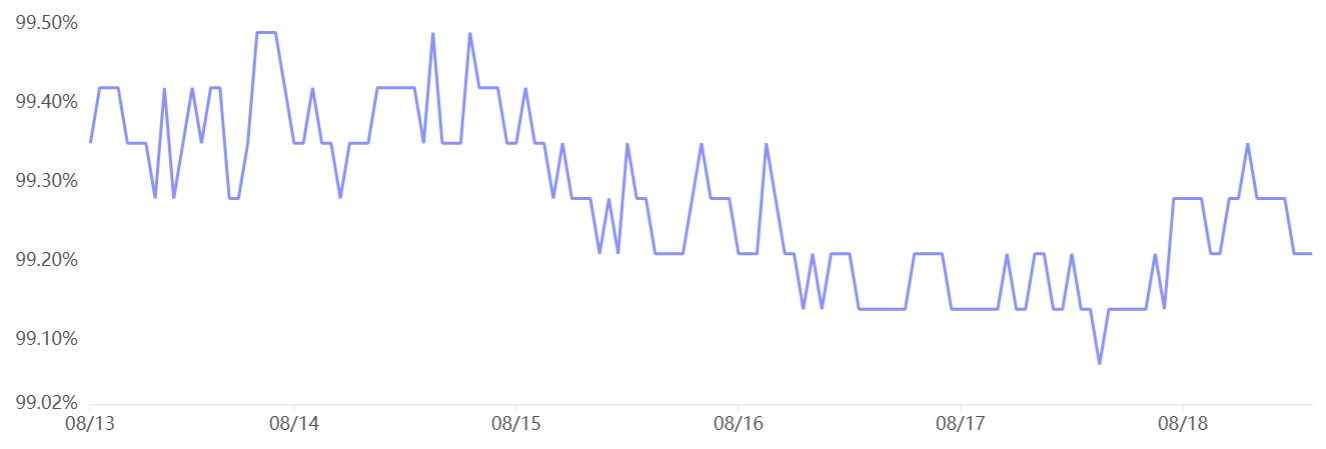
At present, Tether (USDT) trades at a 0.8% discount in China, indicating mild pressure to leave crypto markets. Still, the figure has remained steady since Friday evening, suggesting no worsening sentiment.
Taken together, these four metrics — options skew, ETF flows, top trader positioning, and stablecoin demand — suggest Bitcoin’s pullback was a temporary setback and point to $114,755 being the likely bottom of this correction.
This article is for general information purposes and is not intended to be and should not be taken as legal or investment advice. The views, thoughts, and opinions expressed here are the author’s alone and do not necessarily reflect or represent the views and opinions of Cointelegraph.


