

The returns of investments are not completely random over time (i.e., do not follow a perfect “random walk”). This contrasts with assumptions in common portfolio construction approaches, such as mean variance optimization (MVO), which generally assume that returns are independent and identically distributed (IID).
In a recent CFA Institute Research Foundation brief, we demonstrated that serial dependence can have a notable impact on efficient portfolios for investors with varying time horizons. In this piece, we focus on how the optimal allocation to six risk factors: size, value, momentum, liquidity, profitability, and investment[1] varies by investment horizon.
We demonstrate that size and value factors become more attractive over longer time horizons, while momentum and profitability factors become less attractive, and that evidence for liquidity and investment factors is more mixed. While it is uncertain to what extent these historical relations will persist, this analysis provides additional evidence that serial correlations should be considered when building portfolios for investors.
A Quick Visit to the Factor Zoo
Factors are designed to capture the returns of a specific set of investments while largely controlling for overall market risk. For example, the value factor would be estimated by subtracting the return of a portfolio of growth stocks from a portfolio of value stocks. To the extent value stocks outperform growth stocks, the factor would have a positive average value, and vice versa.
There are a variety of ways to define and build factors. For example, to determine where a security falls on the value/growth continuum, Fama and French use book-to-mark. There are other potential definitions, however, including price-to-earnings, dividend yields, and price-to-sales, among others.
The number of factors identified in research pieces continues to grow. While some of these factors may add new ways to help explain the cross section of stock returns, many are likely to add little actual benefit, especially when considering the marginal contribution of the respective factor beyond existing identified factors. This is something Feng, Giglio, and Xiu (2020) dub the “factor zoo.” Among the 150+ factors reviewed in their research, only a few were economically significant when considered collectively.
For this analysis, we focus on six relatively well-known factors: size, value, momentum, liquidity, profitability, and investment. Here is some additional information on reach:
- Size (SMB): small companies tend to outperform large companies, see Fama and French (1992)
- Value (HML): value companies tend to outperform growth companies, see Fama and French (1992)
- Momentum (MOM): stocks that have been trading up tend to continue performing well in the short-term, see Jegadeesh and Titman (1993)
- Liquidity (LIQ): less-liquid stocks offer higher expected returns to compensate for lower liquidity, see Pastor and Stambaugh (2003)
- Profitability (RMW): companies with robust operating profitability outperform those with weak operating profitability, see Fama and French (2015)
- Investment (CMA): companies that invest conservatively outperform those that invest aggressively, see Fama and French (2015)
These factors are not intended to span the universe of known factors. Rather, they reflect a set of factors that have a have a reasonable amount of freely available historical data for 60+ years. Data for each factor is obtained from Kenneth French’s data library[2] except for the liquidity factor (LIQ), which is obtained from Lubos Pastor’s data library[3]. For LIQ, we use the non-traded liquidity factor for the first four years (1964 to 1967, inclusive) and the traded liquidity factor thereafter. The analysis uses calendar year returns from 1964 to 2023 (60 years). The analysis begins in 1964 because that’s when data on the profitability factors (RMW) and the investment factors (CMA) are first available on Kenneth French’s Data Library.
Exhibit 1 includes data on rolling five-year cumulative returns for the factors.
Exhibit 1. Five-Year Cumulative Returns: 1964-2023.
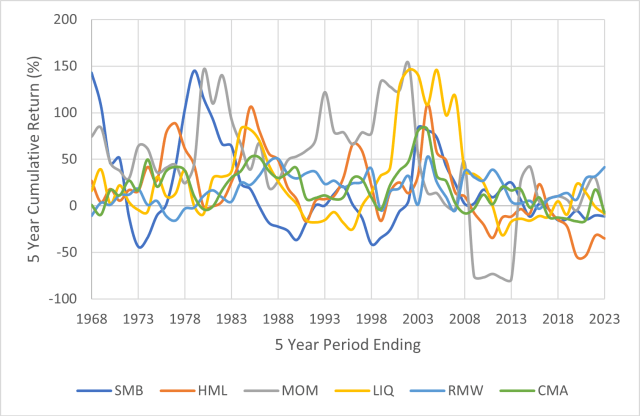
Source: Authors’ Calculations, Kenneth French’s Data Library, Lubos Pastor Data Library, and Morningstar Direct. Data as of December 31, 2023.
The historical differences in rolling five-year returns for some factors are relatively staggering. For example, for the five-year period ending December 31, 2013, MOM had a cumulative return of -78.95% while SMB had a cumulative return +24.81%. Alternatively, SMB had a cumulative five-year return of -34.50% as of December 31, 1999, versus +132.90% for MOM. In other words, there have been significant periods of outperformance and underperformance among the factors, suggesting some potential diversification benefits for allocating across them historically.
The recent returns of each of the factors have generally been lower than the long-term averages. For example, while SMB and HML had annual geometric returns of 4.22% and 4.97%, respectively, from 1968 to 1992 (i.e., pre-discovery), the annual geometric returns have only been 0.3% and 0.1%, respectively, from 1993 to 2023 (i.e., post-discovery), a relatively well-documented decline.
Wealth Growth Over the Long Run
First, to provide some perspective on how the risk of the factors varies by investment horizon, we estimate how the standard deviation of wealth changes for the factors for different investment horizons, looking at periods from one to 10 years. For each period, we compare the actual historical distribution of wealth growth using the actual historical sequential returns (e.g., all the rolling five-year periods available from 1964 to 2023) to the standard deviation of wealth using the same investment period but using bootstrapped returns.
Bootstrapping is an approach where the historical annual returns are used, but they are effectively recombined to generate wealth growth. For each factor we consider 10,000 bootstrapped periods. Bootstrapping is useful when exploring serial correlation because it preserves the unique aspects of the times series data, by capturing the means and covariances, as well as the annual skewness and kurtosis. But bootstrapping removes the serial dependence potentially present in the return. In other words, the only difference in the analysis is how the returns are related to each other over time. If there is no type of serial dependence, the annualized standard deviation values would effectively be constant over time, consistent with the assumptions of IID. However, it’s possible that risk levels could increase or decrease, depending on the serial correlations present. Exhibit 2 includes the results of this analysis.
Exhibit 2. Annualized Standard Deviation Ratios for Factors, Real Returns: 1964-2023.
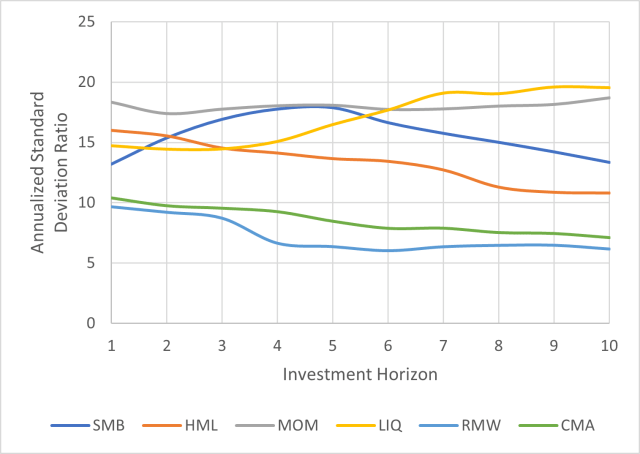
Source: Authors’ Calculations, Kenneth French’s Data Library, Lubos Pastor Data Library, and Morningstar Direct. Data as of December 31, 2023.
There are clear differences in the risk levels across factors, both in terms of absolute values, as well as how they change by investment horizon. For example, MOM had the highest one-year standard deviation, while RMW had the lowest. While the changes by investment horizon are not perfectly linear, there are clearly differences. For example, the annualized standard deviation ratio of HML appears to decline over time, while LIQ increases.
For our analysis, we are primarily focused on how the risk changes over time versus its one-year values. This is because the one-year values would traditionally be captured in an optimization routine that assumes returns are IID, while any changes in risk for longer investment horizons would not be (since serial correlation is typically ignored).
To provide some numerical context on how the risk levels change by investment horizon we perform a series of ordinary least squares (OLS) regressions, where the standard deviation ratios are the dependent variable and investment horizon is the independent variable. The results are reported in Exhibit 3, for both nominal and real returns, while Exhibit 2 included only real returns. A negative slope value in Exhibit 3 would suggest that risk decreases as the investment horizon increases (compared to the one-year value) and vice versa.
Exhibit 3. Slopes of Annualized Standard Deviation Ratios: 1964-2023.
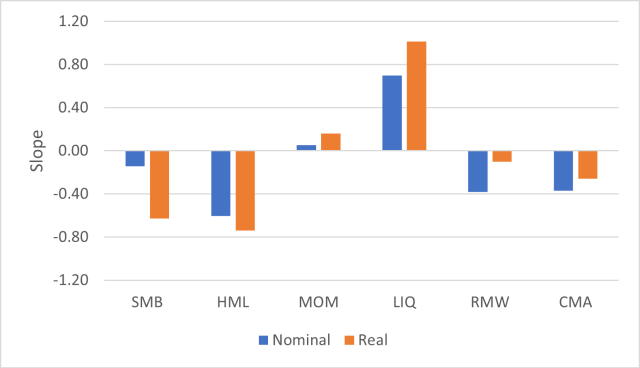
Source: Authors’ Calculations, Kenneth French’s Data Library, Lubos Pastor Data Library, and Morningstar Direct. Data as of December 31, 2023.
We can see negative slopes for factors such as SMB and HML. This would generally imply these factors become more attractive for longer-term investors, ceteris paribus. The notably positive slope for LIQ suggests the factor would become less attractive (in theory, ignoring any other diversification benefits). Generally speaking, any coefficient with an absolute value greater than 0.2 in Exhibit 3 had a coefficient that was statistically significant at the 5% level.

Portfolio Optimizations
To determine how the optimal factor weights would vary by investment horizon, a series of optimizations are performed using an approach that seeks to maximize the expected utility of wealth assuming Constant Relative Risk Aversion (CRRA), as noted in equation 1. CRRA is a power utility function, which is broadly used in academic literature, especially exploring how optimal portfolios vary by investment horizon.
We create two broad sets of portfolios to optimize and have two sets of optimizations. For the first set of optimizations we solve for the optimal factor weights individually (i.e., considering only one factor) and the for the second set we solve the optimal allocation to the factors simultaneously (including all six factors in the same optimization). Since the results of optimizations are similar, we only report the second set, which is the joint optimizations, since these are more relevant to investors building portfolios that involve making decisions among the opportunity set of factors considered, although a reader interested in the first set can get them by reaching out to the authors.
For the optimizations, the factor weights are constrained between -1 and 1. To minimize any potential bias associated with the differences in the historical returns across factors (especially since discovery), we re-center the historical returns so that each factor has an average return of 0% and a standard deviation of 10%. Since the factors do not improve the return of the portfolio, any allocation (positive or negative) would be based entirely on the potential diversification benefits.
Two general levels of risk tolerance are considered: high and moderate, with risk aversion coefficients of 1 and 4, respectively. These would generally be consistent with target equity levels of 100% and 60%, respectively. For aggressive risk tolerance levels, the factors are overlaid only on the market portfolio, while for the moderate risk tolerance level there is an assumed allocation of 60% in the market portfolio and 40% allocation to the risk-free asset.
Exhibit 4 includes the optimal allocations for the factors by investment period and Exhibit 5 includes information about how the slope of the factor coefficients (dependent variable) change by investment horizon (independent variable).
Exhibit 4. Optimal Factor Allocation by Investment Period, All Factors Considered Jointly.
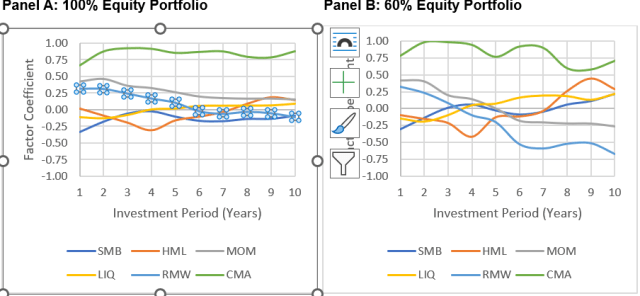
Source: Authors’ Calculations, Kenneth French’s Data Library, Lubos Pastor Data Library, and Morningstar Direct. Data as of December 31, 2023.
Exhibit 5. Optimal Factor Coefficient Slope by Investment Period.
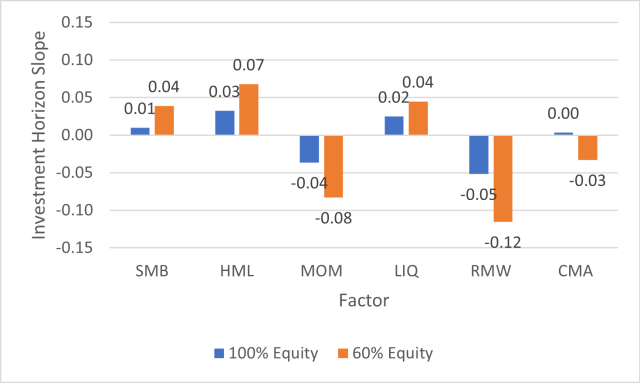
Source: Authors’ Calculations, Kenneth French’s Data Library, Lubos Pastor Data Library, and Morningstar Direct. Data as of December 31, 2023.
The results in Exhibit 5 are similar to those in Exhibit 3, although there are important differences. For example, the slopes for SMB and HML are positive, suggesting that allocations increase over longer investment horizons. This is consistent with the decreasing risk coefficients noted in Exhibit 3. In contrast, allocations to MOM and RMW decline over longer investment horizons. Note, MOM is especially unattractive when considered jointly including the other factors) versus in isolation.
The fact that the allocations to LIQ increase by investment horizon is somewhat surprising given that the annualized standard deviation ratio increases by investment horizon. This can likely be attributed to the historical longer-term diversification effects of the factor. More research on this benefit is warranted.
Conclusions
This post explores how the optimal allocations to six factors — size, value, momentum, liquidity, profitability, and investment — change across investment horizon. The results suggest that serial dependencies exist within factors and that while assuming returns are random may seem like a reasonable simplifying assumption, ignoring serial dependencies could result in portfolio allocations that are less efficient than if these effects were considered.
References
Fama, Eugene F., and Kenneth R. French. 1992. “The Cross-Section of Expected Stock Returns.” Journal of Finance, vol. 47: 427–465.
Fama, Eugene F., and Kenneth R. French. 2015. “A Five-Factor Asset pricing Model.” Journal of Financial Economics, vol. 116, no. 1: 1-22.
Feng, Guanhao, Stefano Giglio, and Dacheng Xiu. 2020. “Taming the Factor Zoo: A Test of New Factors.” Journal of Finance, vol. 75, no. 3: 1327-1370.
Jegadeesh, Narasimhan and Sheridan Titman. 1993. “Returns to Buying Winners and Selling Losers: Implications for Stock Market Efficiency.” Journal of Finance, vol. 48: 65–91.
Pastor, Lubos, and Robert Stambaugh. 2003. “Liquidity Risk and Expected Stock Returns.”
Journal of Political Economy, vol. 111: 642-685.
[1] Size and value were included in both this original research and this piece for completeness purposes.
[2] https://mba.tuck.dartmouth.edu/pages/faculty/ken.french/data_library.html
[3] https://faculty.chicagobooth.edu/lubos-pastor/data


