

M2 money supply has pushed boundaries in multiple respects this decade.
For more than a century, Wall Street has been a stomping ground for wealth creation. No other asset class has come particularly close to matching the annualized return of stocks spanning 100 years.
However, this doesn't mean stocks move higher in a straight line. Volatility is the price investors pay for admission to the world's greatest wealth creator — and 2025 has been chock-full of volatility.
During a one-week stretch in April, the ageless Dow Jones Industrial Average (^DJI 0.77%) and broad-based S&P 500 (^GSPC 0.83%) dipped into correction territory, while the Nasdaq Composite (^IXIC 1.02%) entered a bear market for the first time in three years. This was followed days later by all three indexes recording their largest single-day point gains since their respective inceptions.
Image source: Getty Images.
When the market vacillates wildly, it's common for investors to seek out clues that might tell them which direction stocks will head next. These clues come in the form of events and data points that have previously correlated with sizable moves higher or lower in one or more of Wall Street's major stock indexes. Though no event or data point can guarantee what's to come, some of these tools have remarkably strong track records of forecasting future returns.
One metric, which has made history on both ends of the spectrum over the last couple of years, is currently foreshadowing a big-time move in stocks.
U.S. money supply has endured two extremes this decade
While there are a number of telling metrics, events, and indicators, such as the stock market entering 2025 at one of its priciest valuations dating back 154 years, perhaps the most eyebrow-raising of them all is U.S. money supply.
Among the numerous measures of money supply, M1 and M2 tend to garner the most attention. The former measures all cash and coins in circulation, as well as demand deposits in a checking account. In other words, it's capital that can be spent immediately.
Meanwhile, M2 takes everything in M1 and adds in savings accounts, money market accounts, and certificates of deposit (CDs) below $100,000. This is still money that can be spent, but it requires more effort to do so. It's this money supply measure that's been all over the map and made history at opposite ends of the spectrum this decade.
Normally, M2 money supply moves up and to the right. This is to say that, with very few exceptions, money supply has been steadily increasing over time. However, these rare exceptions have been doozies.
WARNING: the Money Supply is officially contracting. 📉
This has only happened 4 previous times in last 150 years.
Each time a Depression with double-digit unemployment rates followed. 😬 pic.twitter.com/j3FE532oac
— Nick Gerli (@nickgerli1) March 8, 2023
The post you see above on X (formerly Twitter) comes from Reventure App CEO Nick Gerli. Even though it's more than two years old and the right side of the chart is now outdated — I'll touch on this in greater detail in a moment — it demonstrates one of the more intriguing correlations we've witnessed over the last 155 years.
Prior to this decade, there had only been four instances where M2 money supply declined by at least 2% on a year-over-year basis: 1878, 1893, 1921, and 1931-1933. All four of these periods respectively correlate with economic depressions for the U.S. economy, as well as double-digit unemployment rates.
Between April 2022 and October 2023, U.S. M2 money supply contracted by more than $1 trillion, equating to a 4.76% peak-to-trough decline. It represented the first time since the Great Depression that M2 fell by at least 2% year over year, as well as more than 2% on a peak-to-trough basis.
Admittedly, things are quite different today than they were during the prior four occurrences where M2 declined by more than 2% on a year-over-year basis. For instance, the Federal Reserve didn't exist in 1878 and 1893. Further, monetary policy and fiscal policy know-how are far greater today than they were in the 1920s or during the Great Depression.
But we've also witnessed money supply make history in the other direction.
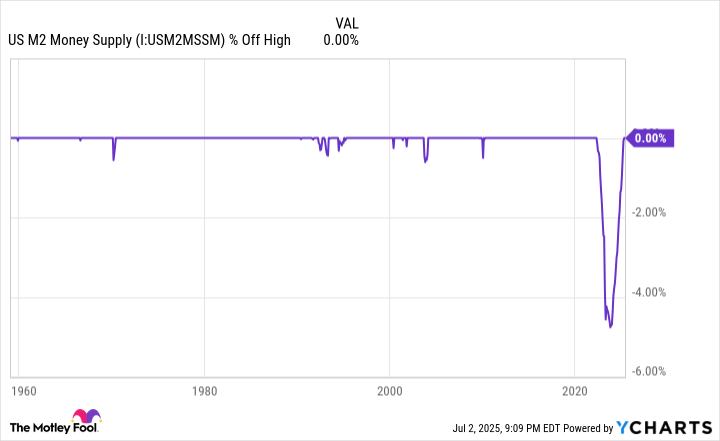
US M2 Money Supply data by YCharts.
For starters, the latest update from the Board of Governors of the Federal Reserve System shows M2 hit an all-time high of $21.942 trillion in May 2025. It's erased the 4.76% peak-to-trough decline from April 2022 to October 2023 in its entirety (and then some!). Steadily climbing money supply is typically something that's observed when the U.S. economy is healthy and expanding, which is often good news for the stock market.
Furthermore, M2 expanded by more than 26% on a year-over-year basis during the height of the COVID-19 pandemic due to fiscal stimulus. When back-tested to 1870, this is, by far, the quickest expansion of money supply in America's history.
Thus, the outsized drop in M2 from April 2022 to October 2023 might have been nothing more than a benign mean reversion following a never-before-seen jump in money supply.
Regardless of which historical M2 money supply moment shines brightest, all point to heightened volatility for the Dow Jones Industrial Average, S&P 500, and Nasdaq Composite.

Image source: Getty Images.
History has a knack for rewarding patience and optimism on Wall Street
Though wild gyrations in Wall Street's major stock indexes can, at times, be scary or tug on the heartstrings of investors, history has demonstrated a knack for rewarding those who exercise patience and perspective, and have an optimistic view on the U.S. economy and stock market.
A perfect example of history rewarding optimists can be seen when examining U.S. economic cycles.
On one hand, recessions are perfectly normal, healthy, and inevitable. No amount of fiscal or monetary policy maneuvering can stop economic slowdowns or downturns from taking shape sometimes. But the one prevailing theme of recessions is their rapid resolution. The average U.S. recession since the end of World War II has resolved in 10 months, and none have lasted longer than 18 months.
In comparison, the average period of economic growth over the last eight decades clocks in at around five years and includes two periods of expansion that surpassed the 10-year mark. With corporate America enjoying far more time in the sun than under the gray clouds of a recession, it's no surprise that stocks have performed so well over extended periods.
This leads to the next point: the disproportionate nature of bull and bear market cycles on Wall Street.
It's official. A new bull market is confirmed.
The S&P 500 is now up 20% from its 10/12/22 closing low. The prior bear market saw the index fall 25.4% over 282 days.
Read more at https://t.co/H4p1RcpfIn. pic.twitter.com/tnRz1wdonp
— Bespoke (@bespokeinvest) June 8, 2023
In June 2023, shortly after the S&P 500 had entered its current bull market, Bespoke Investment Group published a data set on X (formerly Twitter) comparing the calendar-day length of every S&P 500 bull and bear market dating back to the start of the Great Depression.
The 27 S&P 500 bear markets that occurred over the nearly 94 years examined stuck around for an average of just 286 calendar days, with the longest bear market enduring only 630 calendar days.
Meanwhile, the typical S&P 500 bull market from September 1929 through June 2023 lasted 1,011 calendar days. Also, if the current bull market is extrapolated to present day, more than half of the 27 S&P 500 bull markets (14 out of 27) have stuck around longer than the lengthiest bear market.
Regardless of the near-term volatility that (presumably) awaits Wall Street, history has shown time and again that investors who exercise patience and allow time to work its magic are handsomely rewarded.


 Stock Sinks As Market Gains: Here’s Why")
 Outpaces Stock Market Gains: What You Should Know")


 Stock Sinks As Market Gains: Here’s Why")
 Stock Dips While Market Gains: Key Facts")